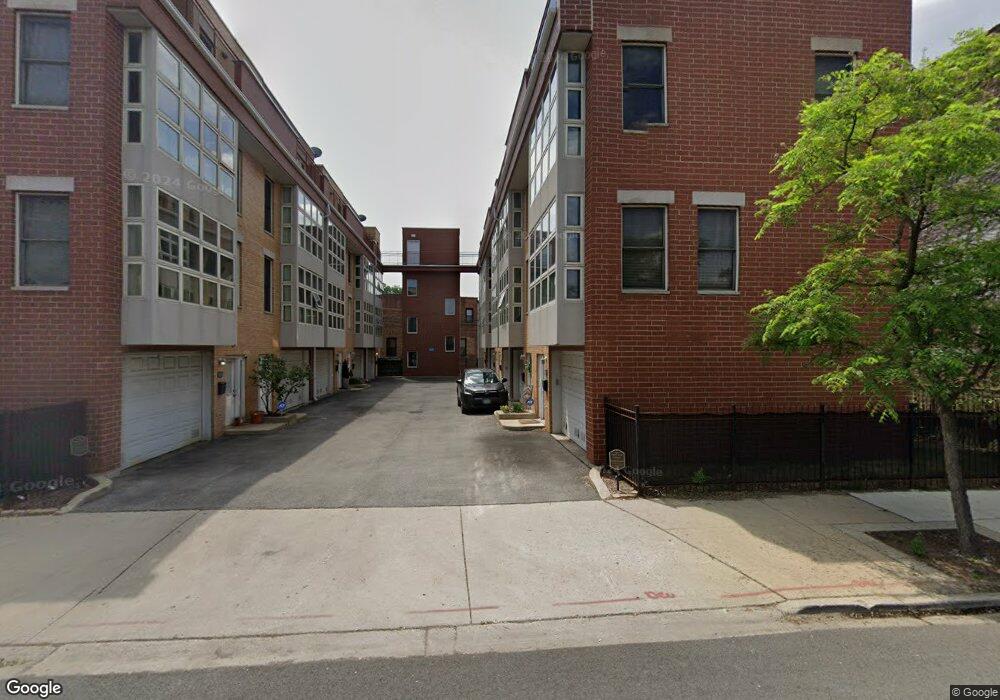
3339 W Irving Park Rd Chicago, IL 60618
Irving Park NeighborhoodEstimated Value: $425,000 - $548,000
4
Beds
3
Baths
1,639
Sq Ft
$297/Sq Ft
Est. Value
About This Home
This home is located at 3339 W Irving Park Rd, Chicago, IL 60618 and is currently estimated at $486,550, approximately $296 per square foot. 3339 W Irving Park Rd is a home located in Cook County with nearby schools including Cleveland Elementary School, Schurz High School, and CICS Irving Park.
Ownership History
Date
Name
Owned For
Owner Type
Purchase Details
Closed on
May 16, 2021
Sold by
Houston Ross Jared and Houston Ellen P
Bought by
Mcmurray Jeffrey and Mcmurray Julia Phelps
Current Estimated Value
Home Financials for this Owner
Home Financials are based on the most recent Mortgage that was taken out on this home.
Original Mortgage
$292,000
Outstanding Balance
$264,211
Interest Rate
3%
Mortgage Type
New Conventional
Estimated Equity
$222,339
Purchase Details
Closed on
May 10, 2018
Sold by
Ruiz Deborah Johnson and Ruiz Ruben
Bought by
Houston Ross Jared and Houston Ellen P
Home Financials for this Owner
Home Financials are based on the most recent Mortgage that was taken out on this home.
Original Mortgage
$294,525
Interest Rate
4.25%
Mortgage Type
New Conventional
Purchase Details
Closed on
Nov 9, 2016
Sold by
Johnson Olympia F
Bought by
Ruiz Deborah Johnson
Purchase Details
Closed on
Jun 13, 2011
Sold by
Gonzalez Danilo and Gonzalez Elena
Bought by
Johnson Olympia F
Create a Home Valuation Report for This Property
The Home Valuation Report is an in-depth analysis detailing your home's value as well as a comparison with similar homes in the area
Home Values in the Area
Average Home Value in this Area
Purchase History
| Date | Buyer | Sale Price | Title Company |
|---|---|---|---|
| Mcmurray Jeffrey | $365,000 | Prairie Title | |
| Houston Ross Jared | $346,500 | Chicago Title | |
| Ruiz Deborah Johnson | -- | Attorney | |
| Johnson Olympia F | $186,000 | Gmt |
Source: Public Records
Mortgage History
| Date | Status | Borrower | Loan Amount |
|---|---|---|---|
| Open | Mcmurray Jeffrey | $292,000 | |
| Previous Owner | Houston Ross Jared | $294,525 |
Source: Public Records
Tax History Compared to Growth
Tax History
| Year | Tax Paid | Tax Assessment Tax Assessment Total Assessment is a certain percentage of the fair market value that is determined by local assessors to be the total taxable value of land and additions on the property. | Land | Improvement |
|---|---|---|---|---|
| 2024 | $7,567 | $44,000 | $4,820 | $39,180 |
| 2023 | $7,372 | $34,000 | $3,878 | $30,122 |
| 2022 | $7,372 | $34,000 | $3,878 | $30,122 |
| 2021 | $6,492 | $34,000 | $3,878 | $30,122 |
| 2020 | $5,991 | $29,903 | $1,772 | $28,131 |
| 2019 | $6,773 | $33,599 | $1,772 | $31,827 |
| 2018 | $6,658 | $33,599 | $1,772 | $31,827 |
| 2017 | $5,946 | $27,528 | $1,551 | $25,977 |
| 2016 | $5,532 | $27,528 | $1,551 | $25,977 |
| 2015 | $5,062 | $27,528 | $1,551 | $25,977 |
| 2014 | $4,807 | $25,815 | $1,329 | $24,486 |
| 2013 | $4,712 | $25,815 | $1,329 | $24,486 |
Source: Public Records
Map
Nearby Homes
- 3940 N Christiana Ave
- 4026 N Kimball Ave
- 3923 N Bernard St
- 3934 N Sawyer Ave
- 3908 N Bernard St
- 3925 N Saint Louis Ave
- 3911 N Saint Louis Ave
- 3853 N Spaulding Ave
- 3223 W Belle Plaine Ave
- 3847 N Spaulding Ave
- 3903 N Drake Ave
- 4155 N Bernard St Unit G
- 3350 W Grace St Unit 3
- 4116 N Kedzie Ave
- 3911 N Kedzie Ave
- 3247 W Berteau Ave
- 3551 W Belle Plaine Ave Unit 2
- 4143 N Drake Ave
- 4027 N Troy St
- 3558 W Belle Plaine Ave Unit 3
- 3339 W Irving Park Rd
- 3339 W Irving Park Rd
- 3339 W Irving Park Rd
- 3339 W Irving Park Rd
- 3339 W Irving Park Rd
- 3339 W Irving Park Rd
- 3339 W Irving Park Rd
- 3339 W Irving Park Rd
- 3339 W Irving Park Rd
- 3339 W Irving Park Rd Unit 4W
- 3339 W Irving Park Rd Unit 3W
- 3339 W Irving Park Rd Unit 2W
- 3339 W Irving Park Rd Unit 1W
- 3339 W Irving Park Rd Unit 4E
- 3339 W Irving Park Rd Unit 2E
- 3339 W Irving Park Rd Unit 5W
- 3337 W Irving Park Rd Unit 1E
- 3337 W Irving Park Rd Unit 3E
- 3337 W Irving Park Rd Unit 2E
- 3337 W Irving Park Rd Unit 5