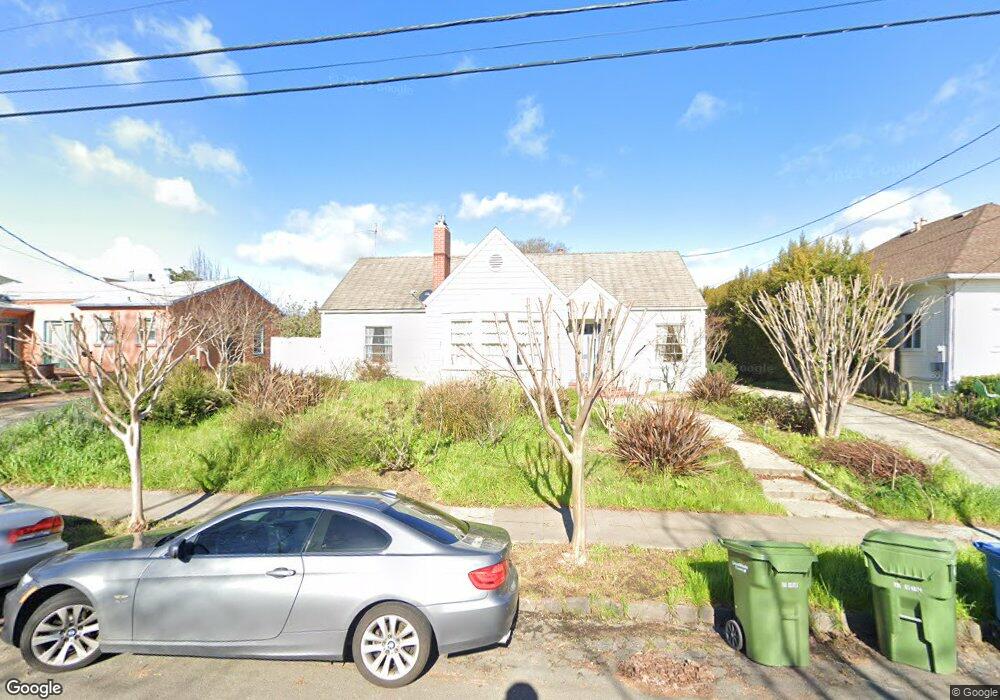
334 Bassett St Petaluma, CA 94952
Western Petaluma NeighborhoodEstimated Value: $1,001,000 - $1,284,000
3
Beds
2
Baths
1,885
Sq Ft
$627/Sq Ft
Est. Value
About This Home
This home is located at 334 Bassett St, Petaluma, CA 94952 and is currently estimated at $1,182,218, approximately $627 per square foot. 334 Bassett St is a home located in Sonoma County with nearby schools including Valley Vista Elementary School, Petaluma Junior High School, and Petaluma High School.
Ownership History
Date
Name
Owned For
Owner Type
Purchase Details
Closed on
Feb 8, 2016
Sold by
Lesch Richard S and Lesch Victor Susan
Bought by
Lesch Victor Living Trust
Current Estimated Value
Purchase Details
Closed on
Feb 23, 1995
Sold by
Finnerty Joseph and Finnerty Agnes
Bought by
Lesch Richard S and Lesch Victor Susan
Home Financials for this Owner
Home Financials are based on the most recent Mortgage that was taken out on this home.
Original Mortgage
$180,000
Interest Rate
5.5%
Create a Home Valuation Report for This Property
The Home Valuation Report is an in-depth analysis detailing your home's value as well as a comparison with similar homes in the area
Home Values in the Area
Average Home Value in this Area
Purchase History
| Date | Buyer | Sale Price | Title Company |
|---|---|---|---|
| Lesch Victor Living Trust | -- | None Available | |
| Lesch Richard S | $226,500 | Old Republic Title Company |
Source: Public Records
Mortgage History
| Date | Status | Borrower | Loan Amount |
|---|---|---|---|
| Closed | Lesch Richard S | $180,000 | |
| Closed | Lesch Richard S | $22,500 |
Source: Public Records
Tax History Compared to Growth
Tax History
| Year | Tax Paid | Tax Assessment Tax Assessment Total Assessment is a certain percentage of the fair market value that is determined by local assessors to be the total taxable value of land and additions on the property. | Land | Improvement |
|---|---|---|---|---|
| 2025 | $4,111 | $375,974 | $199,634 | $176,340 |
| 2024 | $4,111 | $368,603 | $195,720 | $172,883 |
| 2023 | $4,111 | $361,377 | $191,883 | $169,494 |
| 2022 | $3,940 | $354,292 | $188,121 | $166,171 |
| 2021 | $3,866 | $347,346 | $184,433 | $162,913 |
| 2020 | $3,897 | $343,785 | $182,542 | $161,243 |
| 2019 | $5,289 | $337,045 | $178,963 | $158,082 |
| 2018 | $3,833 | $330,437 | $175,454 | $154,983 |
| 2017 | $3,753 | $323,959 | $172,014 | $151,945 |
| 2016 | $3,659 | $317,608 | $168,642 | $148,966 |
| 2015 | $3,608 | $312,838 | $166,109 | $146,729 |
| 2014 | $3,590 | $306,711 | $162,856 | $143,855 |
Source: Public Records
Map
Nearby Homes