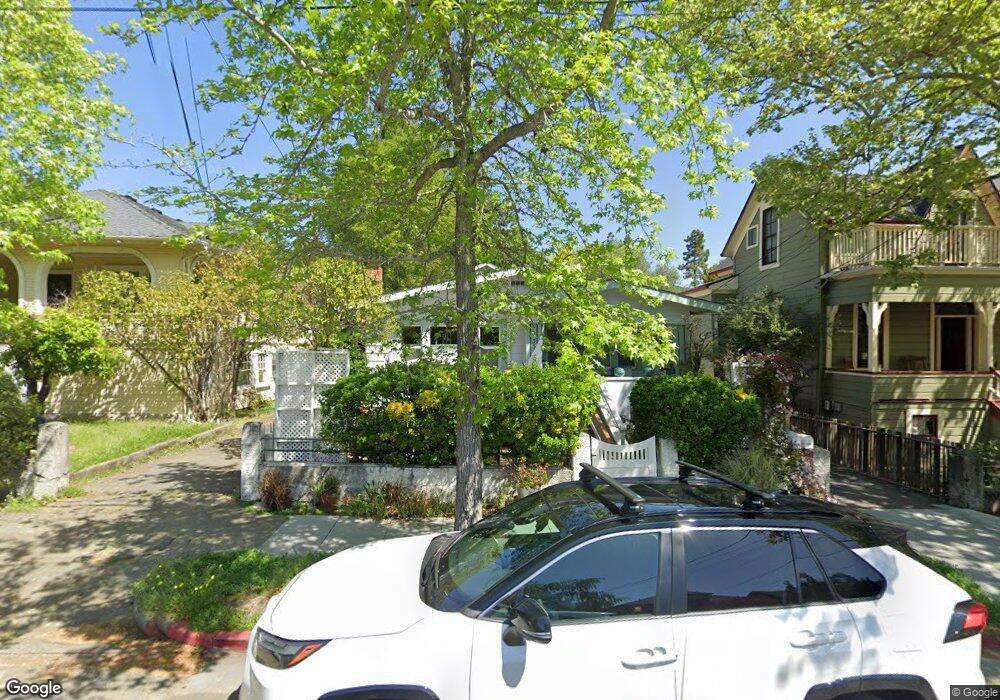
334 Bayview St San Rafael, CA 94901
Gerstle Park NeighborhoodEstimated Value: $1,310,000 - $1,584,000
5
Beds
3
Baths
2,504
Sq Ft
$589/Sq Ft
Est. Value
About This Home
This home is located at 334 Bayview St, San Rafael, CA 94901 and is currently estimated at $1,474,364, approximately $588 per square foot. 334 Bayview St is a home located in Marin County with nearby schools including Sun Valley Elementary School, James B. Davidson Middle School, and San Rafael High School.
Ownership History
Date
Name
Owned For
Owner Type
Purchase Details
Closed on
Nov 8, 2006
Sold by
Pearson Florence
Bought by
Richardson Bay Land Co Inc
Current Estimated Value
Purchase Details
Closed on
Feb 11, 2005
Sold by
Pearson Florence S L
Bought by
Pearson Florence
Purchase Details
Closed on
Jan 11, 2005
Sold by
Pearson Linda J
Bought by
Pearson Florence S L
Create a Home Valuation Report for This Property
The Home Valuation Report is an in-depth analysis detailing your home's value as well as a comparison with similar homes in the area
Home Values in the Area
Average Home Value in this Area
Purchase History
| Date | Buyer | Sale Price | Title Company |
|---|---|---|---|
| Richardson Bay Land Co Inc | $810,000 | Old Republic Title Company | |
| Pearson Florence | -- | -- | |
| Pearson Florence S L | -- | -- |
Source: Public Records
Tax History Compared to Growth
Tax History
| Year | Tax Paid | Tax Assessment Tax Assessment Total Assessment is a certain percentage of the fair market value that is determined by local assessors to be the total taxable value of land and additions on the property. | Land | Improvement |
|---|---|---|---|---|
| 2025 | $16,119 | $1,085,140 | $803,808 | $281,332 |
| 2024 | $16,119 | $1,063,870 | $788,052 | $275,818 |
| 2023 | $15,766 | $1,043,012 | $772,602 | $270,410 |
| 2022 | $14,951 | $1,022,568 | $757,458 | $265,110 |
| 2021 | $14,723 | $1,002,520 | $742,608 | $259,912 |
| 2020 | $14,592 | $992,241 | $734,994 | $257,247 |
| 2019 | $14,070 | $972,793 | $720,588 | $252,205 |
| 2018 | $13,942 | $953,726 | $706,464 | $247,262 |
| 2017 | $13,443 | $935,031 | $692,616 | $242,415 |
| 2016 | $13,007 | $916,701 | $679,038 | $237,663 |
| 2015 | $11,567 | $825,000 | $600,000 | $225,000 |
| 2014 | $10,919 | $795,505 | $576,055 | $219,450 |
Source: Public Records
Map
Nearby Homes