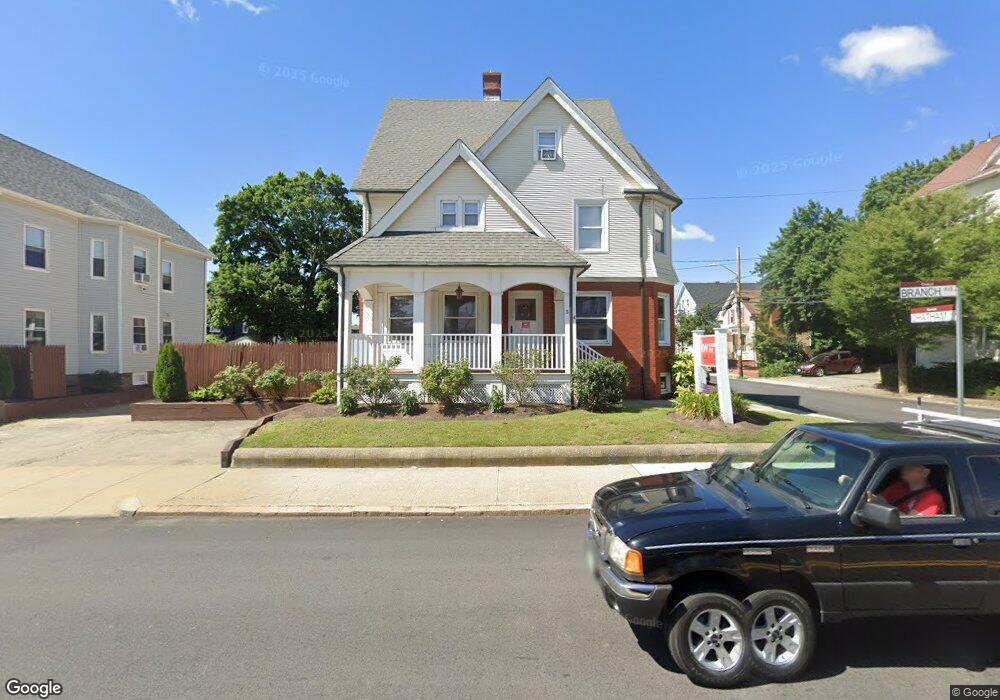
334 Branch Ave Providence, RI 02904
Charles Neighborhood
7
Beds
3
Baths
3,660
Sq Ft
5,663
Sq Ft Lot
About This Home
This home is located at 334 Branch Ave, Providence, RI 02904. 334 Branch Ave is a home located in Providence County with nearby schools including Asa Messer Elementary School, Charles N. Fortes Elementary School, and Veazie Street Elementary School.
Ownership History
Date
Name
Owned For
Owner Type
Purchase Details
Closed on
Jun 1, 2012
Sold by
Harrington Const Inc
Bought by
3 Branch Llc
Purchase Details
Closed on
Apr 8, 2010
Sold by
Ortega Felix
Bought by
Harrington Constr Inc
Home Financials for this Owner
Home Financials are based on the most recent Mortgage that was taken out on this home.
Original Mortgage
$15,000
Interest Rate
5.12%
Purchase Details
Closed on
Jul 3, 2000
Sold by
Schneider Leslie J and Schneider Virginia F
Bought by
Perez Mayra
Create a Home Valuation Report for This Property
The Home Valuation Report is an in-depth analysis detailing your home's value as well as a comparison with similar homes in the area
Home Values in the Area
Average Home Value in this Area
Purchase History
| Date | Buyer | Sale Price | Title Company |
|---|---|---|---|
| 3 Branch Llc | -- | -- | |
| 3 Branch Llc | -- | -- | |
| Harrington Constr Inc | $107,500 | -- | |
| Harrington Constr Inc | $107,500 | -- | |
| Perez Mayra | $160,000 | -- | |
| Perez Mayra | $160,000 | -- |
Source: Public Records
Mortgage History
| Date | Status | Borrower | Loan Amount |
|---|---|---|---|
| Previous Owner | Perez Mayra | $15,000 | |
| Previous Owner | Perez Mayra | $75,000 |
Source: Public Records
Tax History Compared to Growth
Tax History
| Year | Tax Paid | Tax Assessment Tax Assessment Total Assessment is a certain percentage of the fair market value that is determined by local assessors to be the total taxable value of land and additions on the property. | Land | Improvement |
|---|---|---|---|---|
| 2025 | $8,754 | $599,600 | $131,800 | $467,800 |
| 2024 | $10,898 | $516,600 | $70,000 | $446,600 |
| 2023 | $10,898 | $516,600 | $70,000 | $446,600 |
| 2022 | $0 | $423,700 | $70,000 | $353,700 |
| 2021 | $0 | $298,400 | $87,600 | $210,800 |
| 2020 | $0 | $298,400 | $87,600 | $210,800 |
| 2019 | $0 | $297,100 | $66,800 | $230,300 |
| 2018 | $6,392 | $200,000 | $51,600 | $148,400 |
| 2017 | $6,392 | $200,000 | $51,600 | $148,400 |
| 2016 | $6,392 | $200,000 | $51,600 | $148,400 |
| 2015 | $3,886 | $117,400 | $54,700 | $62,700 |
| 2014 | $3,962 | $117,400 | $54,700 | $62,700 |
| 2013 | $3,962 | $117,400 | $54,700 | $62,700 |
Source: Public Records
Map
Nearby Homes