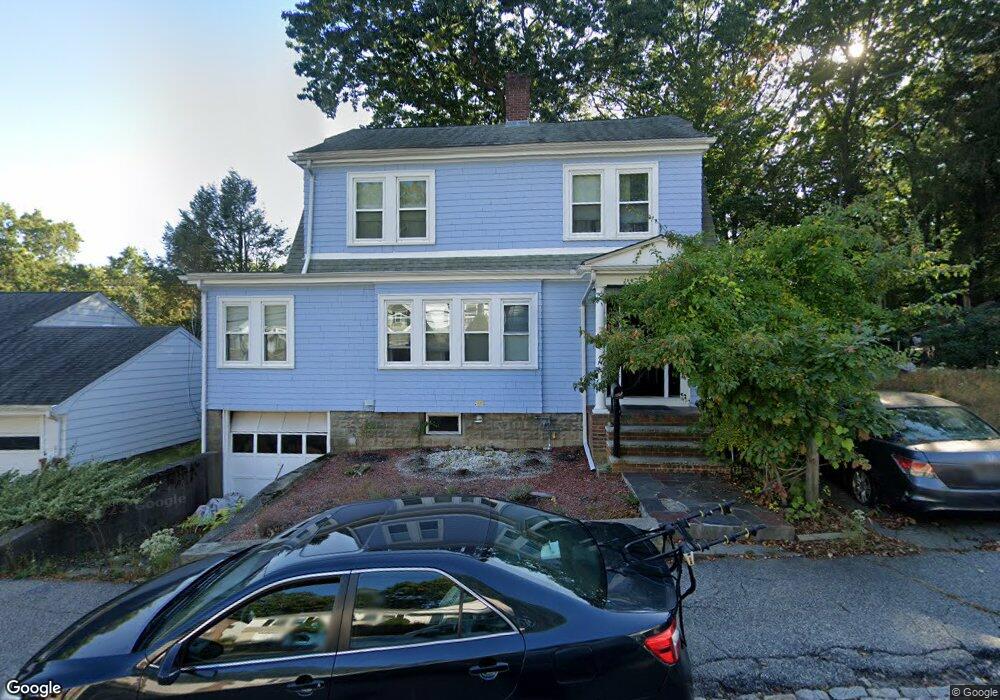
334 Corey St West Roxbury, MA 02132
West Roxbury NeighborhoodEstimated Value: $788,747 - $963,000
3
Beds
2
Baths
1,496
Sq Ft
$582/Sq Ft
Est. Value
About This Home
This home is located at 334 Corey St, West Roxbury, MA 02132 and is currently estimated at $869,937, approximately $581 per square foot. 334 Corey St is a home located in Suffolk County with nearby schools including Holy Name Parish School, St Theresa School, and Catholic Memorial School.
Ownership History
Date
Name
Owned For
Owner Type
Purchase Details
Closed on
Feb 28, 1994
Sold by
Mazzella August F and Mazzella Barbara A
Bought by
Rosario Edwin and Rosario Lillian B
Current Estimated Value
Create a Home Valuation Report for This Property
The Home Valuation Report is an in-depth analysis detailing your home's value as well as a comparison with similar homes in the area
Home Values in the Area
Average Home Value in this Area
Purchase History
| Date | Buyer | Sale Price | Title Company |
|---|---|---|---|
| Rosario Edwin | $161,500 | -- |
Source: Public Records
Mortgage History
| Date | Status | Borrower | Loan Amount |
|---|---|---|---|
| Open | Rosario Edwin | $100,000 | |
| Open | Rosario Edwin | $190,000 |
Source: Public Records
Tax History Compared to Growth
Tax History
| Year | Tax Paid | Tax Assessment Tax Assessment Total Assessment is a certain percentage of the fair market value that is determined by local assessors to be the total taxable value of land and additions on the property. | Land | Improvement |
|---|---|---|---|---|
| 2025 | $7,593 | $655,700 | $209,700 | $446,000 |
| 2024 | $6,992 | $641,500 | $227,800 | $413,700 |
| 2023 | $6,688 | $622,700 | $221,100 | $401,600 |
| 2022 | $6,159 | $566,100 | $201,000 | $365,100 |
| 2021 | $5,571 | $522,100 | $191,500 | $330,600 |
| 2020 | $5,315 | $503,300 | $171,300 | $332,000 |
| 2019 | $5,099 | $483,800 | $138,400 | $345,400 |
| 2018 | $4,695 | $448,000 | $138,400 | $309,600 |
| 2017 | $4,650 | $439,100 | $138,400 | $300,700 |
| 2016 | $4,472 | $406,500 | $138,400 | $268,100 |
| 2015 | $4,931 | $407,200 | $143,500 | $263,700 |
| 2014 | $4,833 | $384,200 | $143,500 | $240,700 |
Source: Public Records
Map
Nearby Homes
- 701 Vfw Pkwy
- 845 Lagrange St Unit 4
- 865 Lagrange St Unit 5
- 89 Dwinell St
- 139 Newfield St
- 76 Vermont St
- 168 Maple St
- 37 Pomfret St
- 931 Lagrange St
- 23 Westgate Rd Unit 6
- 1307 Lagrange St Unit 1307
- 577 Baker St Unit 577
- 579 Baker St Unit 579
- 9 Carroll St
- 42 Bryon Rd Unit 6
- 21 Westgate Rd Unit 6
- 64 Bryon Rd Unit 1
- 331 Vermont St
- 539 Lagrange St
- 76 Potomac St
- 11 Brook Farm Rd
- 330 Corey St
- 19 Brook Farm Rd
- 351 Corey St
- 355 Corey St
- 21 Brook Farm Rd
- 347 Corey St
- 715 Vfw Pkwy
- 6 Brook Farm Rd
- 6 Brook Farm Rd Unit 1
- 354 Corey St
- 2 Brook Farm Rd Unit 2
- 2 Brook Farm Rd
- 24 Brook Farm Rd
- 343 Corey St
- 22 Brook Farm Rd
- 357 Corey St
- 11 Cricket Ln
- 25 Brook Farm Rd
- 352 Corey St