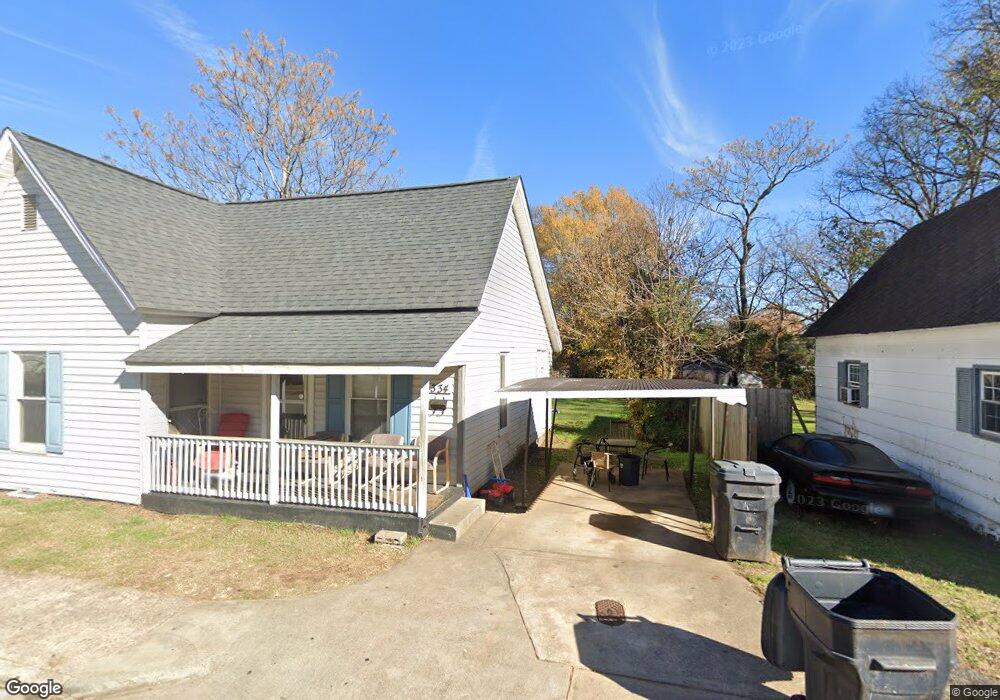
334 F St Anderson, SC 29625
Estimated Value: $51,000 - $105,000
2
Beds
1
Bath
1,100
Sq Ft
$72/Sq Ft
Est. Value
About This Home
This home is located at 334 F St, Anderson, SC 29625 and is currently estimated at $79,042, approximately $71 per square foot. 334 F St is a home located in Anderson County with nearby schools including Centerville Elementary School, Westside High School, and Anderson Institute of Technology.
Ownership History
Date
Name
Owned For
Owner Type
Purchase Details
Closed on
Mar 10, 2011
Sold by
Eloy Investments Llc
Bought by
Cornerstone National Bank
Current Estimated Value
Purchase Details
Closed on
Dec 31, 2008
Sold by
Upstate Property Development
Bought by
Eloy Investments Llc
Purchase Details
Closed on
Jul 26, 2005
Sold by
Clay James
Bought by
Upstate Property Development
Purchase Details
Closed on
Nov 21, 2003
Sold by
Rucker Betty J
Bought by
Clay James
Create a Home Valuation Report for This Property
The Home Valuation Report is an in-depth analysis detailing your home's value as well as a comparison with similar homes in the area
Home Values in the Area
Average Home Value in this Area
Purchase History
| Date | Buyer | Sale Price | Title Company |
|---|---|---|---|
| Cornerstone National Bank | -- | -- | |
| Eloy Investments Llc | -- | -- | |
| Upstate Property Development | $16,000 | -- | |
| Clay James | $14,500 | -- |
Source: Public Records
Tax History Compared to Growth
Tax History
| Year | Tax Paid | Tax Assessment Tax Assessment Total Assessment is a certain percentage of the fair market value that is determined by local assessors to be the total taxable value of land and additions on the property. | Land | Improvement |
|---|---|---|---|---|
| 2024 | $423 | $760 | $220 | $540 |
| 2023 | $423 | $760 | $220 | $540 |
| 2022 | $387 | $760 | $220 | $540 |
| 2021 | $368 | $680 | $210 | $470 |
| 2020 | $362 | $680 | $210 | $470 |
| 2019 | $362 | $680 | $210 | $470 |
| 2018 | $359 | $680 | $210 | $470 |
| 2017 | -- | $680 | $210 | $470 |
| 2016 | $352 | $670 | $210 | $460 |
| 2015 | $352 | $670 | $210 | $460 |
| 2014 | $344 | $670 | $210 | $460 |
Source: Public Records
Map
Nearby Homes