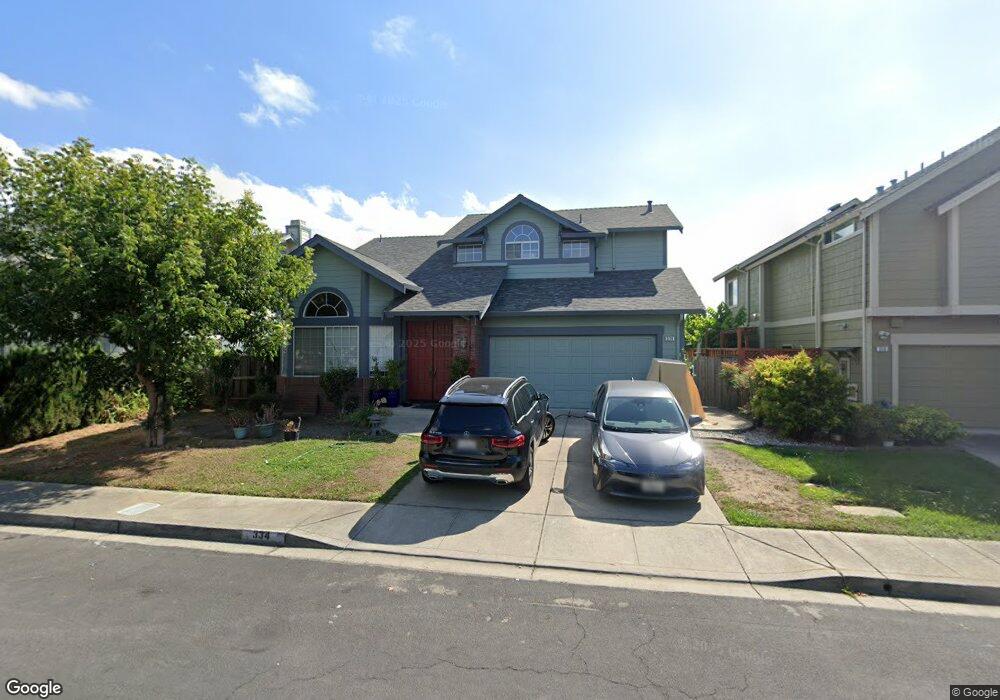
334 Loverin Ct Hayward, CA 94544
Tennyson-Alquire NeighborhoodEstimated Value: $1,025,060 - $1,172,000
4
Beds
3
Baths
1,785
Sq Ft
$630/Sq Ft
Est. Value
About This Home
This home is located at 334 Loverin Ct, Hayward, CA 94544 and is currently estimated at $1,125,015, approximately $630 per square foot. 334 Loverin Ct is a home located in Alameda County with nearby schools including Ruus Elementary School, Cesar Chavez Middle School, and Tennyson High School.
Ownership History
Date
Name
Owned For
Owner Type
Purchase Details
Closed on
Oct 22, 2024
Sold by
Fe And Wilfredo Supetran Family Trust and Supetran Ryan
Bought by
Din Sayed and Safi Pakiza
Current Estimated Value
Home Financials for this Owner
Home Financials are based on the most recent Mortgage that was taken out on this home.
Original Mortgage
$700,000
Outstanding Balance
$692,430
Interest Rate
6.2%
Mortgage Type
New Conventional
Estimated Equity
$432,585
Purchase Details
Closed on
Nov 5, 2018
Sold by
Supetran Fe Agoot and Supetran Wilfredo Paloma
Bought by
Supetran Fe Agoot and Supetran Wilfredo Paloma
Purchase Details
Closed on
Dec 28, 2007
Sold by
Supetran Ryan and Agoot Ryan Christopher
Bought by
Supetran Ryan and Supetran Wilfredo P
Purchase Details
Closed on
Feb 26, 2007
Sold by
Supetran Wilfredo P and Supetran Fe A
Bought by
Supetran Ryan
Home Financials for this Owner
Home Financials are based on the most recent Mortgage that was taken out on this home.
Original Mortgage
$485,000
Interest Rate
6.21%
Mortgage Type
Negative Amortization
Create a Home Valuation Report for This Property
The Home Valuation Report is an in-depth analysis detailing your home's value as well as a comparison with similar homes in the area
Home Values in the Area
Average Home Value in this Area
Purchase History
| Date | Buyer | Sale Price | Title Company |
|---|---|---|---|
| Din Sayed | $1,200,000 | Old Republic Title | |
| Supetran Fe Agoot | -- | None Available | |
| Supetran Fe Agoot | -- | None Available | |
| Supetran Ryan | -- | None Available | |
| Supetran Ryan | $735,000 | Alliance Title Company |
Source: Public Records
Mortgage History
| Date | Status | Borrower | Loan Amount |
|---|---|---|---|
| Open | Din Sayed | $700,000 | |
| Previous Owner | Supetran Ryan | $485,000 |
Source: Public Records
Tax History Compared to Growth
Tax History
| Year | Tax Paid | Tax Assessment Tax Assessment Total Assessment is a certain percentage of the fair market value that is determined by local assessors to be the total taxable value of land and additions on the property. | Land | Improvement |
|---|---|---|---|---|
| 2025 | $5,764 | $1,200,000 | $360,000 | $840,000 |
| 2024 | $5,764 | $434,893 | $135,967 | $305,926 |
| 2023 | $5,670 | $433,229 | $133,301 | $299,928 |
| 2022 | $5,553 | $417,736 | $130,688 | $294,048 |
| 2021 | $5,504 | $409,407 | $128,125 | $288,282 |
| 2020 | $5,439 | $412,139 | $126,812 | $285,327 |
| 2019 | $5,479 | $404,057 | $124,325 | $279,732 |
| 2018 | $5,148 | $396,136 | $121,888 | $274,248 |
| 2017 | $5,025 | $388,369 | $119,498 | $268,871 |
| 2016 | $4,735 | $380,757 | $117,156 | $263,601 |
| 2015 | $4,735 | $375,038 | $115,396 | $259,642 |
| 2014 | $4,676 | $367,693 | $113,136 | $254,557 |
Source: Public Records
Map
Nearby Homes
- 552 Celia St
- 32 Astrida Dr Unit 2
- 41 Astrida Dr Unit 9
- 28222 Lustig Ct
- 29223 Whalebone Way
- 29223 Whalebone Way Unit 404
- 37 Lance Way
- 29138 Delgado Rd
- 28315 Rochelle Ave
- 878 Folsom Ave
- 29288 Chance St
- 29133 De la Cruz Rd
- 29235 Lone Tree Place
- 29255 Harpoon Way
- 132 Jiminez Way Unit 6
- 27894 Andrea St
- 29129 Verdi Rd
- 29129 Verdi Rd Unit 29129
- 933 New England Village Dr
- 1127 Hat Creek Way