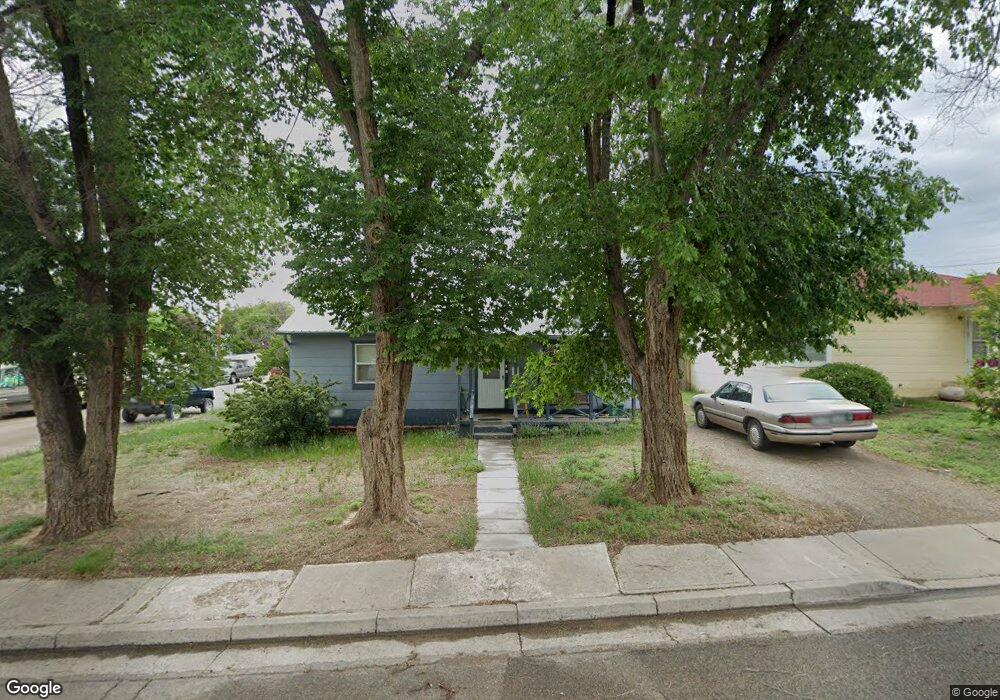
334 N Linden St Cortez, CO 81321
Estimated Value: $226,426 - $256,000
2
Beds
1
Bath
925
Sq Ft
$257/Sq Ft
Est. Value
About This Home
This home is located at 334 N Linden St, Cortez, CO 81321 and is currently estimated at $238,107, approximately $257 per square foot. 334 N Linden St is a home with nearby schools including Montezuma-Cortez High School, Children's Kiva Montessori School, and Children's Kiva Montessori Preschool & Kindergarten.
Ownership History
Date
Name
Owned For
Owner Type
Purchase Details
Closed on
Jun 3, 2020
Sold by
Martinez Rhonda Sue and Madden Adrena Mann
Bought by
Durrett Sarah J
Current Estimated Value
Home Financials for this Owner
Home Financials are based on the most recent Mortgage that was taken out on this home.
Original Mortgage
$85,000
Outstanding Balance
$59,890
Interest Rate
3.3%
Mortgage Type
New Conventional
Estimated Equity
$178,217
Purchase Details
Closed on
Dec 11, 2018
Sold by
Madden Adrena
Bought by
Martinez Rhonda S
Purchase Details
Closed on
Mar 24, 2016
Sold by
Martinez Rhonda Sue
Bought by
Martinez Rhonda Sue and Madden Adrena Ann
Purchase Details
Closed on
Mar 27, 1996
Sold by
Durrett Randall G
Bought by
Durrett Alva E and Durrett Loretta Y
Purchase Details
Closed on
Apr 27, 1995
Sold by
Mcconnel Mildred R
Bought by
Durrett Randall G
Create a Home Valuation Report for This Property
The Home Valuation Report is an in-depth analysis detailing your home's value as well as a comparison with similar homes in the area
Home Values in the Area
Average Home Value in this Area
Purchase History
| Date | Buyer | Sale Price | Title Company |
|---|---|---|---|
| Durrett Sarah J | -- | None Available | |
| Martinez Rhonda S | $2,600 | None Available | |
| Martinez Rhonda Sue | -- | None Available | |
| Durrett Alva E | $56,300 | -- | |
| Durrett Randall G | $52,000 | -- |
Source: Public Records
Mortgage History
| Date | Status | Borrower | Loan Amount |
|---|---|---|---|
| Open | Durrett Sarah J | $85,000 |
Source: Public Records
Tax History Compared to Growth
Tax History
| Year | Tax Paid | Tax Assessment Tax Assessment Total Assessment is a certain percentage of the fair market value that is determined by local assessors to be the total taxable value of land and additions on the property. | Land | Improvement |
|---|---|---|---|---|
| 2024 | $480 | $9,344 | $2,023 | $7,321 |
| 2023 | $480 | $13,722 | $2,971 | $10,751 |
| 2022 | $442 | $9,141 | $1,356 | $7,785 |
| 2021 | $450 | $9,141 | $1,356 | $7,785 |
| 2020 | $386 | $8,161 | $1,492 | $6,669 |
| 2019 | $388 | $8,167 | $1,492 | $6,675 |
| 2018 | $397 | $6,230 | $1,350 | $4,880 |
| 2017 | $395 | $6,230 | $1,350 | $4,880 |
| 2016 | $357 | $6,220 | $1,490 | $4,730 |
| 2015 | $164 | $84,450 | $0 | $0 |
| 2014 | $192 | $3,120 | $0 | $0 |
Source: Public Records
Map
Nearby Homes
- 240 N Elm St
- 210 W Coronado Ave
- 409 N Broadway
- 537 N Elm St
- 235 N Chestnut St Unit 6
- 521 N Beech St
- 23 E Montezuma Ave
- 102 E Montezuma Ave
- Tract 9 N Broadway
- 416 N Ash St
- 323 N Washington St
- 115 S Linden St
- 122 E 1st St Unit see broker remarks
- 243 N Madison St
- 625 N Harrison St
- TRACT 12 N Broadway
- TBD Lebanon Rd
- Tract 10 Road K 3
- 420 W 4th St
- 506 Amanda Lee Ln
- 330 N Linden St
- 326 N Linden St
- 402 N Linden St
- 345 N Linden St
- W Downey Ave Unit Lots 1-6 Koehler Sub
- W Downey Ave
- 221 W Downey Ave Unit Lots 1-6 Koehler Sub
- 221 W Downey Ave
- 318 N Linden St
- 327 N Linden St
- 406 N Linden St
- 335 N Linden St
- 403 N Linden St
- 207 W Downey Ave
- 210 W Downey Ave
- 323 N Linden St
- 413 N Linden St
- 201 W Downey Ave
- 424 N Linden St
- 305 N Linden St