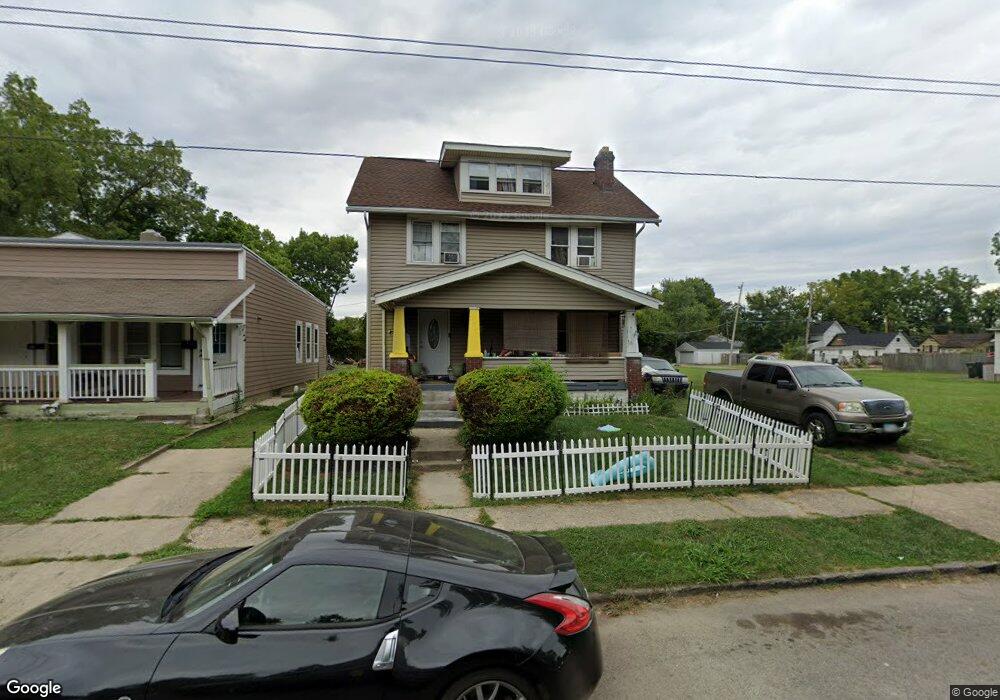
334 S Highland Ave Columbus, OH 43223
Central Hilltop NeighborhoodEstimated Value: $188,000 - $211,000
3
Beds
2
Baths
1,967
Sq Ft
$100/Sq Ft
Est. Value
About This Home
This home is located at 334 S Highland Ave, Columbus, OH 43223 and is currently estimated at $196,756, approximately $100 per square foot. 334 S Highland Ave is a home located in Franklin County with nearby schools including Burroughs Elementary School, Hilltonia Middle School, and Briggs High School.
Ownership History
Date
Name
Owned For
Owner Type
Purchase Details
Closed on
Jun 29, 2001
Sold by
Naumoff Properties Llc
Bought by
Marshall Dushawn D and Marshall Latasha
Current Estimated Value
Purchase Details
Closed on
Nov 28, 2000
Sold by
Companion Mtg Corp
Bought by
Naumoff Properties Llc
Purchase Details
Closed on
Aug 7, 2000
Sold by
Hausman Amber
Bought by
Companion Mtg Corp
Create a Home Valuation Report for This Property
The Home Valuation Report is an in-depth analysis detailing your home's value as well as a comparison with similar homes in the area
Home Values in the Area
Average Home Value in this Area
Purchase History
| Date | Buyer | Sale Price | Title Company |
|---|---|---|---|
| Marshall Dushawn D | $85,000 | Charter Title Agency | |
| Naumoff Properties Llc | $20,000 | -- | |
| Companion Mtg Corp | $30,600 | -- |
Source: Public Records
Tax History Compared to Growth
Tax History
| Year | Tax Paid | Tax Assessment Tax Assessment Total Assessment is a certain percentage of the fair market value that is determined by local assessors to be the total taxable value of land and additions on the property. | Land | Improvement |
|---|---|---|---|---|
| 2024 | $2,704 | $57,200 | $6,410 | $50,790 |
| 2023 | $2,534 | $57,190 | $6,405 | $50,785 |
| 2022 | $2,847 | $25,940 | $2,070 | $23,870 |
| 2021 | $1,348 | $25,940 | $2,070 | $23,870 |
| 2020 | $1,350 | $25,940 | $2,070 | $23,870 |
| 2019 | $1,279 | $21,080 | $1,720 | $19,360 |
| 2018 | $1,295 | $21,080 | $1,720 | $19,360 |
| 2017 | $1,278 | $21,080 | $1,720 | $19,360 |
| 2016 | $1,447 | $21,840 | $3,360 | $18,480 |
| 2015 | $1,313 | $21,840 | $3,360 | $18,480 |
| 2014 | $1,317 | $21,840 | $3,360 | $18,480 |
| 2013 | $764 | $25,690 | $3,955 | $21,735 |
Source: Public Records
Map
Nearby Homes
- 304 S Highland Ave
- 307 S Wheatland Ave
- 225 S Highland Ave
- 221 S Highland Ave
- 244 Clarendon Ave
- 2264 Shelton St
- 226 Clarendon Ave
- 249 Midland Ave
- 321 S Oakley Ave
- 379 Midland Ave
- 2263 Shelton St
- 216 S Oakley Ave
- 329-331 Whitethorne Ave
- 327-329 S Wayne Ave
- 337 S Wayne Ave
- 137 S Highland Ave
- 349 S Eureka Ave
- 172 Whitethorne Ave
- 426 S Eureka Ave
- 151 S Wayne Ave Unit 153
- 326-332 S Highland Ave
- 326 S Highland Ave Unit 332
- 342 S Highland Ave
- 320 S Highland Ave
- 350 S Highland Ave
- 356 S Highland Ave
- 312 S Highland Ave
- 356 Highland Way
- 308 S Highland Ave
- 0 S Highland Ave
- 360 S Highland Ave
- 333 S Highland Ave
- 2249 Pervience St Unit 251
- 2249-2251 Pervience St
- 2249 Perviance St
- 2251 Pervience St
- 2254 Sheridan St
- 0 Sheridan St
- 337 S Highland Ave
- 304 S Highland Ave Unit ABC