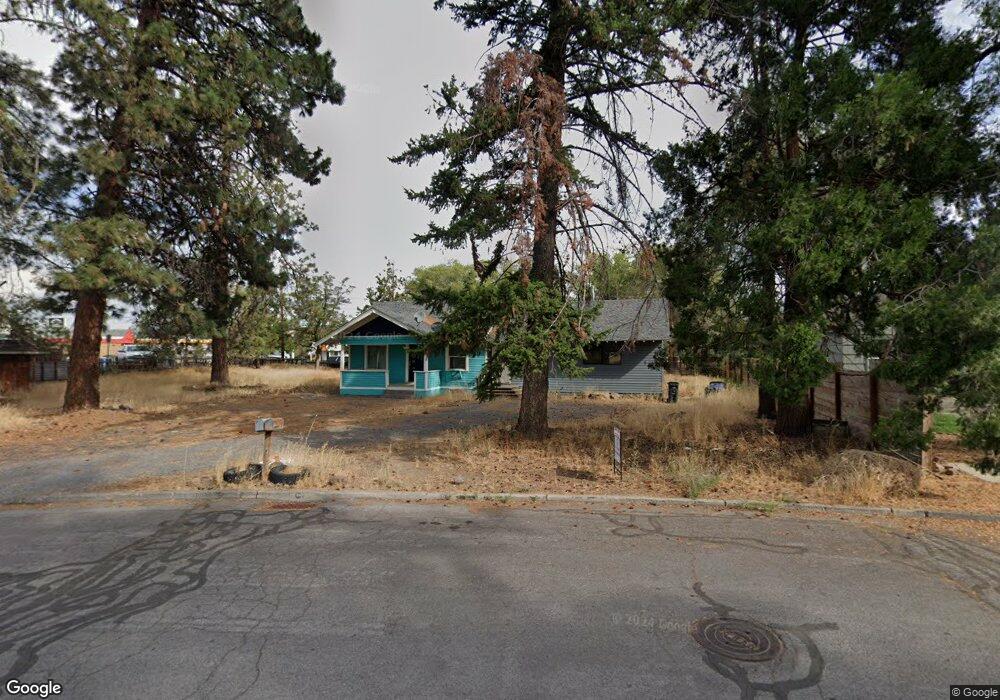
334 SE Lee Ln Unit A&B Bend, OR 97702
Larkspur NeighborhoodEstimated Value: $565,000 - $742,000
4
Beds
2
Baths
2,422
Sq Ft
$267/Sq Ft
Est. Value
About This Home
This home is located at 334 SE Lee Ln Unit A&B, Bend, OR 97702 and is currently estimated at $645,954, approximately $266 per square foot. 334 SE Lee Ln Unit A&B is a home located in Deschutes County with nearby schools including Juniper Elementary School, Bend Senior High School, and Deschutes River Montessori School.
Ownership History
Date
Name
Owned For
Owner Type
Purchase Details
Closed on
Sep 27, 2024
Sold by
Carole Alley Family Trust and Meuret Michael F
Bought by
Evans Christopher William and Davenport Natalie Rae
Current Estimated Value
Home Financials for this Owner
Home Financials are based on the most recent Mortgage that was taken out on this home.
Original Mortgage
$463,200
Outstanding Balance
$457,565
Interest Rate
6.49%
Mortgage Type
New Conventional
Estimated Equity
$188,389
Purchase Details
Closed on
Dec 22, 2004
Sold by
Alley Carole D
Bought by
Carole Alley Family Trust
Create a Home Valuation Report for This Property
The Home Valuation Report is an in-depth analysis detailing your home's value as well as a comparison with similar homes in the area
Home Values in the Area
Average Home Value in this Area
Purchase History
| Date | Buyer | Sale Price | Title Company |
|---|---|---|---|
| Evans Christopher William | $579,000 | Western Title | |
| Carole Alley Family Trust | -- | -- |
Source: Public Records
Mortgage History
| Date | Status | Borrower | Loan Amount |
|---|---|---|---|
| Open | Evans Christopher William | $463,200 |
Source: Public Records
Tax History Compared to Growth
Tax History
| Year | Tax Paid | Tax Assessment Tax Assessment Total Assessment is a certain percentage of the fair market value that is determined by local assessors to be the total taxable value of land and additions on the property. | Land | Improvement |
|---|---|---|---|---|
| 2025 | $4,577 | $270,860 | -- | -- |
| 2024 | $4,403 | $262,980 | -- | -- |
| 2023 | $4,082 | $255,330 | $0 | $0 |
| 2022 | $3,808 | $240,680 | $0 | $0 |
| 2021 | $3,814 | $233,670 | $0 | $0 |
| 2020 | $3,618 | $233,670 | $0 | $0 |
| 2019 | $3,518 | $226,870 | $0 | $0 |
| 2018 | $3,419 | $220,270 | $0 | $0 |
| 2017 | $3,318 | $213,860 | $0 | $0 |
| 2016 | $3,165 | $207,640 | $0 | $0 |
| 2015 | $3,077 | $201,600 | $0 | $0 |
| 2014 | $2,986 | $195,730 | $0 | $0 |
Source: Public Records
Map
Nearby Homes
- 322 SE 5th St
- 530 SE 3rd St
- 501 SE Wilson Ave
- 477 SE Roosevelt Ave
- 195 SE Roosevelt Ave
- 688 SE Centennial St
- 624 SW Hill St
- 757 SW Pelton Place Unit 7
- 623 SE Roosevelt Ave
- 8 SW Mckinley Ave
- 106 NW Colorado Ave
- 211 SW Log Ct
- 274 SW Bluff Dr
- 205 SW Log Ct
- 114 NW Delaware Ave
- 363 SW Bluff Dr Unit 103
- 291 SW Bluff Dr Unit 210
- 977 SW Hill St
- 1063 SW Crosscut Ct
- 334 SW Roosevelt Ave Unit 3
- 334 SE Lee Ln
- 354 SE Lee Ln
- 314 SE 3rd St
- 364 SE Woodland Blvd
- 304 SE 3rd St
- 370 SE Woodland Blvd
- 373 SE Lee Ln
- 374 SE Woodland Blvd
- 255 SE 4th St
- 360 SE Dell Ln
- 265 SE 4th St
- 378 SE Woodland Blvd
- 415 SE Woodland Blvd
- 261 SE 4th St
- 315 SE 3rd St
- 355 SE Miller Ave
- 365 SE Miller Ave
- 388 SE Dell Ln
- 396 SE Dell Ln
- 383 SE Miller Ave