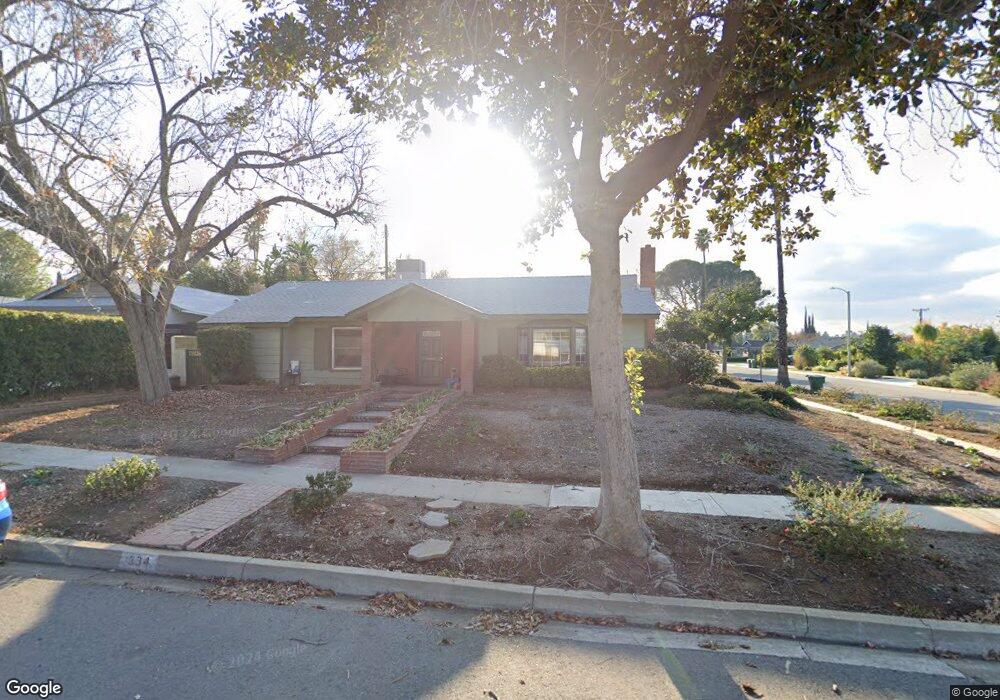
334 Sherwood St Redlands, CA 92373
South Redlands NeighborhoodEstimated Value: $601,000 - $664,000
3
Beds
2
Baths
1,466
Sq Ft
$429/Sq Ft
Est. Value
About This Home
This home is located at 334 Sherwood St, Redlands, CA 92373 and is currently estimated at $628,324, approximately $428 per square foot. 334 Sherwood St is a home located in San Bernardino County with nearby schools including Smiley Elementary School, Cope Middle School, and Redlands Senior High School.
Ownership History
Date
Name
Owned For
Owner Type
Purchase Details
Closed on
Sep 18, 2004
Sold by
Fredricksen Jack R and Fredricksen Karen W
Bought by
Fredricksen Jack R and Fredricksen Karen W
Current Estimated Value
Home Financials for this Owner
Home Financials are based on the most recent Mortgage that was taken out on this home.
Original Mortgage
$75,000
Interest Rate
5.8%
Mortgage Type
Credit Line Revolving
Purchase Details
Closed on
Aug 31, 1999
Sold by
Fredricksen Jack R
Bought by
Livin Jack R and Livin Karen W Fredricksen Joint
Create a Home Valuation Report for This Property
The Home Valuation Report is an in-depth analysis detailing your home's value as well as a comparison with similar homes in the area
Home Values in the Area
Average Home Value in this Area
Purchase History
| Date | Buyer | Sale Price | Title Company |
|---|---|---|---|
| Fredricksen Jack R | -- | First American | |
| Livin Jack R | -- | -- |
Source: Public Records
Mortgage History
| Date | Status | Borrower | Loan Amount |
|---|---|---|---|
| Closed | Fredricksen Jack R | $75,000 |
Source: Public Records
Tax History Compared to Growth
Tax History
| Year | Tax Paid | Tax Assessment Tax Assessment Total Assessment is a certain percentage of the fair market value that is determined by local assessors to be the total taxable value of land and additions on the property. | Land | Improvement |
|---|---|---|---|---|
| 2025 | $3,163 | $277,815 | $64,395 | $213,420 |
| 2024 | $3,163 | $272,367 | $63,132 | $209,235 |
| 2023 | $3,158 | $267,026 | $61,894 | $205,132 |
| 2022 | $3,110 | $261,790 | $60,680 | $201,110 |
| 2021 | $3,165 | $256,657 | $59,490 | $197,167 |
| 2020 | $3,118 | $254,025 | $58,880 | $195,145 |
| 2019 | $3,029 | $249,044 | $57,725 | $191,319 |
| 2018 | $2,952 | $244,161 | $56,593 | $187,568 |
| 2017 | $2,926 | $239,373 | $55,483 | $183,890 |
| 2016 | $2,891 | $234,679 | $54,395 | $180,284 |
| 2015 | $2,869 | $231,154 | $53,578 | $177,576 |
| 2014 | $2,816 | $226,626 | $52,528 | $174,098 |
Source: Public Records
Map
Nearby Homes
- 1239 Fulbright Ave
- 325 Lakeside Ave
- 1302 San Pablo Ave
- 1324 W Fern Ave
- 162 Lakeside Ave
- 1417 Bella Vista Crescent
- 526 Nottingham Dr
- 527 Nottingham Dr
- 133 S San Mateo St
- 1110 W Cypress Ave
- 1044 W Cypress Ave
- 1522 Blossom Ct
- 0 Sunnyside Ave Unit IG25092932
- 636 Harding Dr
- 628 Sunnyside Ave
- 975 Brookside Ave
- 521 Bond St
- 805 Nottingham Dr
- 153 Channing St
- 51 Orangewood Ct
- 338 Sherwood St
- 335 Nottingham Dr
- 339 Nottingham Dr
- 342 Sherwood St
- 1220 Laurel Ave
- 1224 Laurel Ave
- 335 Sherwood St
- 339 Sherwood St
- 343 Nottingham Dr
- 1216 Laurel Ave
- 1228 Laurel Ave
- 343 Sherwood St
- 346 Sherwood St
- 326 San Rafael St
- 1232 Laurel Ave
- 1209 Laurel Ave
- 347 Nottingham Dr
- 334 Nottingham Dr
- 1219 Fulbright Ave
- 1223 Fulbright Ave