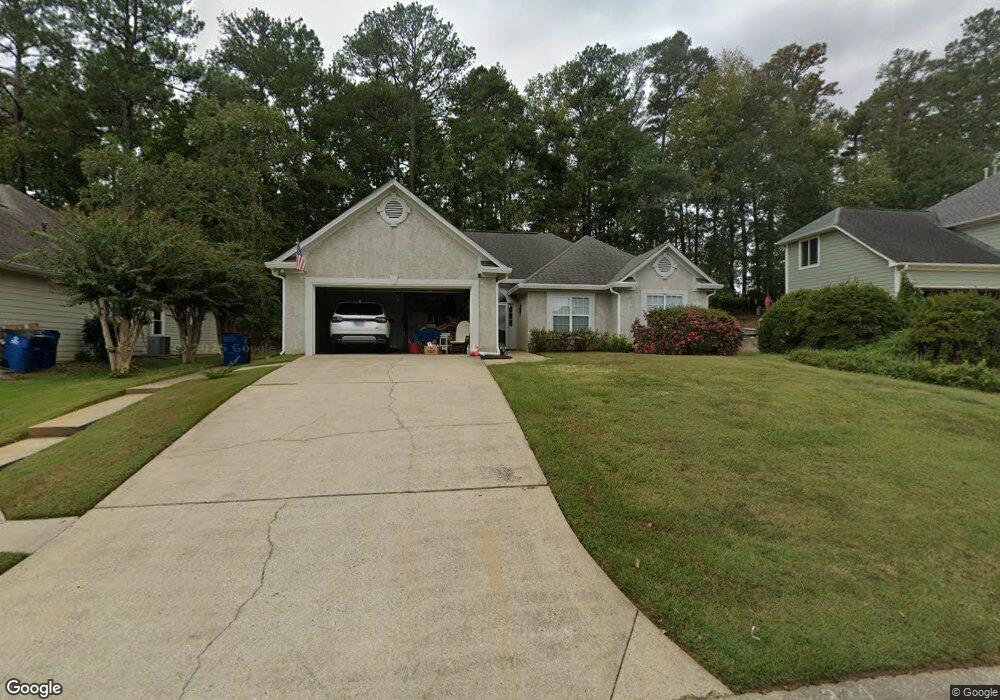
334 Vendella Cir Peachtree City, GA 30269
Estimated Value: $429,963 - $496,000
--
Bed
2
Baths
1,605
Sq Ft
$293/Sq Ft
Est. Value
About This Home
This home is located at 334 Vendella Cir, Peachtree City, GA 30269 and is currently estimated at $470,491, approximately $293 per square foot. 334 Vendella Cir is a home located in Fayette County with nearby schools including Kedron Elementary School, Booth Middle School, and McIntosh High School.
Ownership History
Date
Name
Owned For
Owner Type
Purchase Details
Closed on
Jul 24, 2018
Sold by
Harrell Charles S
Bought by
Harrell Living Trust
Current Estimated Value
Purchase Details
Closed on
Oct 25, 2002
Sold by
Hug Robert J and Hug Mary A
Bought by
Harrell Charles S and Harrell Gail L
Home Financials for this Owner
Home Financials are based on the most recent Mortgage that was taken out on this home.
Original Mortgage
$148,000
Interest Rate
6.01%
Mortgage Type
New Conventional
Purchase Details
Closed on
Aug 13, 1997
Sold by
Oyler Bart C
Bought by
Hug Robert J and Hug Mary Ann
Home Financials for this Owner
Home Financials are based on the most recent Mortgage that was taken out on this home.
Original Mortgage
$117,200
Interest Rate
7.46%
Mortgage Type
New Conventional
Purchase Details
Closed on
Dec 13, 1996
Sold by
Wright Inc
Bought by
Oyler Bart C Rebecca M
Create a Home Valuation Report for This Property
The Home Valuation Report is an in-depth analysis detailing your home's value as well as a comparison with similar homes in the area
Home Values in the Area
Average Home Value in this Area
Purchase History
| Date | Buyer | Sale Price | Title Company |
|---|---|---|---|
| Harrell Living Trust | -- | -- | |
| Harrell Charles S | $185,000 | -- | |
| Hug Robert J | $146,500 | -- | |
| Oyler Bart C Rebecca M | $140,700 | -- |
Source: Public Records
Mortgage History
| Date | Status | Borrower | Loan Amount |
|---|---|---|---|
| Previous Owner | Harrell Charles S | $148,000 | |
| Previous Owner | Hug Robert J | $117,200 | |
| Closed | Oyler Bart C Rebecca M | $0 |
Source: Public Records
Tax History Compared to Growth
Tax History
| Year | Tax Paid | Tax Assessment Tax Assessment Total Assessment is a certain percentage of the fair market value that is determined by local assessors to be the total taxable value of land and additions on the property. | Land | Improvement |
|---|---|---|---|---|
| 2024 | $1,589 | $160,160 | $51,960 | $108,200 |
| 2023 | $1,390 | $154,840 | $51,960 | $102,880 |
| 2022 | $2,180 | $124,760 | $22,800 | $101,960 |
| 2021 | $2,124 | $107,640 | $22,800 | $84,840 |
| 2020 | $2,073 | $100,320 | $22,800 | $77,520 |
| 2019 | $3,094 | $101,880 | $22,800 | $79,080 |
| 2018 | $3,053 | $99,000 | $22,800 | $76,200 |
| 2017 | $3,101 | $99,840 | $22,800 | $77,040 |
| 2016 | $2,626 | $80,840 | $22,800 | $58,040 |
| 2015 | $2,492 | $75,600 | $22,800 | $52,800 |
| 2014 | $2,406 | $71,840 | $22,800 | $49,040 |
| 2013 | -- | $70,640 | $0 | $0 |
Source: Public Records
Map
Nearby Homes
- 231 Clifton Ln
- 249 Clifton Ln
- 308 Dalston Way
- 413 Silverbell Ct
- 103 Ardenlee Dr
- 325 Caledonia Ct
- 152 Ardenlee Dr
- 510 Cunninghame Ct
- 125 Red Maple Dr
- 404 Las Brasis Ct
- 206 Las Brasis Ct
- 512 Las Brasis Ct
- 203 Lenox Dr
- 522 Colebrook Way
- 308 Corrigan Trace
- 544 Colebrook Way
- 321 Cottonwood Cir
- 549 Colebrook Way
- 100 Leisure Trail
- 324 Elkins Place
- 332 Vendella Cir
- 336 Vendella Cir
- 330 Vendella Cir
- 321 Vendella Cir
- 319 Vendella Cir
- 323 Vendella Cir
- 100 Belvedere Ln
- 102 Belvedere Ln
- 317 Vendella Cir
- 328 Vendella Cir
- 104 Belvedere Ln
- 203 Belvedere Green
- 201 Belvedere Green
- 0 Belvedere Green Unit 8701490
- 0 Belvedere Green Unit 9031704
- 0 Belvedere Green Unit 8736716
- 0 Belvedere Green Unit 8750283
- 0 Belvedere Green Unit 8879553
- 0 Belvedere Green Unit 7548924
- 0 Belvedere Green