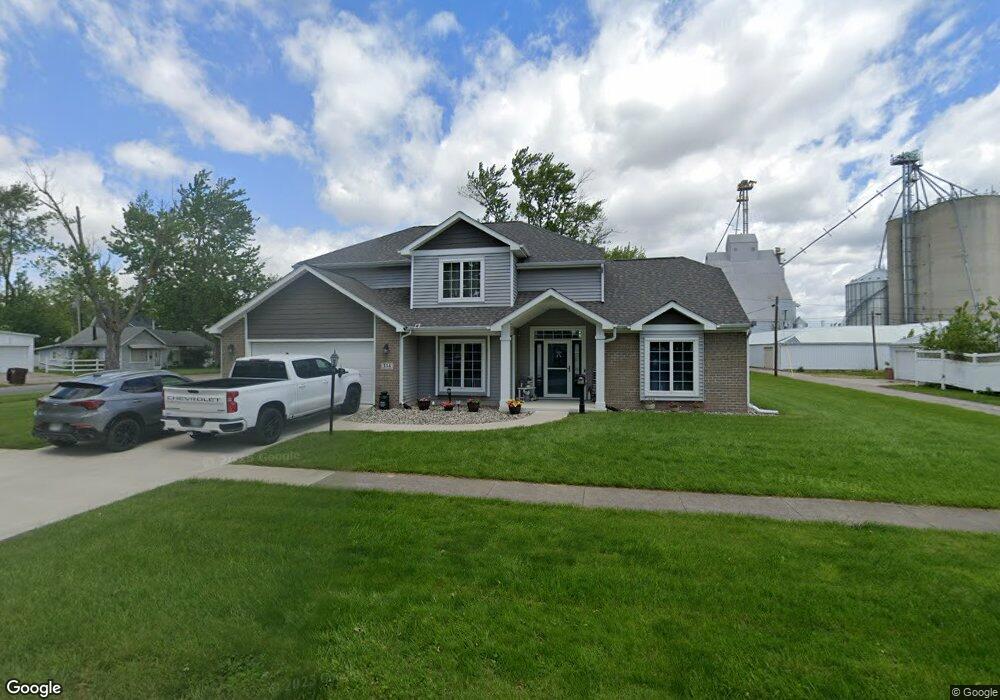
334 W Perry St Paulding, OH 45879
Estimated Value: $222,000 - $293,000
3
Beds
3
Baths
2,264
Sq Ft
$118/Sq Ft
Est. Value
About This Home
This home is located at 334 W Perry St, Paulding, OH 45879 and is currently estimated at $266,463, approximately $117 per square foot. 334 W Perry St is a home located in Paulding County with nearby schools including Paulding High School.
Ownership History
Date
Name
Owned For
Owner Type
Purchase Details
Closed on
Dec 4, 2019
Sold by
Boyd Robert L
Bought by
Bustos Jonathan P and Bustos Erin A
Current Estimated Value
Purchase Details
Closed on
Aug 21, 2018
Sold by
Iler Marcy J and Iler Michael E
Bought by
Boyd Robert L
Purchase Details
Closed on
Jun 1, 2010
Sold by
Petrila Joycee A
Bought by
Iier Marey J and Iier Michael E
Purchase Details
Closed on
May 22, 2010
Sold by
Saldana Terrill Jean
Bought by
Iler Marcy J and Iler Michael E
Purchase Details
Closed on
Mar 11, 2010
Sold by
Reinhart Michael W
Bought by
Her Marcy J and Petrila Joyce A
Purchase Details
Closed on
Nov 6, 2003
Sold by
Wilhelm Florice M
Bought by
Iler Marcy J and Iler Michael E
Create a Home Valuation Report for This Property
The Home Valuation Report is an in-depth analysis detailing your home's value as well as a comparison with similar homes in the area
Home Values in the Area
Average Home Value in this Area
Purchase History
| Date | Buyer | Sale Price | Title Company |
|---|---|---|---|
| Bustos Jonathan P | $7,900 | None Available | |
| Boyd Robert L | $6,900 | None Available | |
| Iier Marey J | -- | None Available | |
| Iler Marcy J | -- | None Available | |
| Her Marcy J | -- | None Available | |
| Iler Marcy J | $17,000 | -- |
Source: Public Records
Tax History
| Year | Tax Paid | Tax Assessment Tax Assessment Total Assessment is a certain percentage of the fair market value that is determined by local assessors to be the total taxable value of land and additions on the property. | Land | Improvement |
|---|---|---|---|---|
| 2025 | $4,317 | $97,830 | $5,990 | $91,840 |
| 2024 | $4,317 | $79,530 | $4,870 | $74,660 |
| 2023 | $3,646 | $79,530 | $4,870 | $74,660 |
| 2022 | $3,542 | $79,530 | $4,870 | $74,660 |
| 2021 | $3,003 | $30,770 | $4,380 | $26,390 |
| 2020 | $1,381 | $3,500 | $3,500 | $0 |
| 2019 | $158 | $3,500 | $3,500 | $0 |
| 2018 | $161 | $3,500 | $3,500 | $0 |
| 2017 | $162 | $3,500 | $3,500 | $0 |
| 2016 | $162 | $3,500 | $3,500 | $0 |
| 2015 | $159 | $3,500 | $3,500 | $0 |
| 2014 | $159 | $3,500 | $3,500 | $0 |
| 2013 | $172 | $3,500 | $3,500 | $0 |
Source: Public Records
Map
Nearby Homes
- 508 W Jackson St
- 520 W Wayne St
- 614 W Jackson St
- 215 N Dewitt St
- 717 W Harrison St
- 714 W Wayne St
- 402 N Williams St
- 308 N Main St
- 301 N Main St
- 516 N Williams St
- 726 N Main St
- 780 N Williams St
- 701 E Wayne St
- 742 E Perry St
- 830 N Walnut St
- 741 Tom Tim Dr
- 1065 Emerald Rd
- 13688 Kay St
- 11051 Road 93
- 225 2nd St
- 334 W Perry St
- vacant lot Perry St
- 402 W Perry St
- 320 W Perry St
- 403 W Jackson St
- 333 W Perry St
- 333 W Jackson St
- 406 W Perry St
- 403 W Perry St
- 325 W Perry St
- 325 W Jackson St
- 325 W Jackson St
- 310 W Perry St
- 409 W Jackson St
- 414 W Perry St
- 109 S Coupland St
- 108 S Coupland St
- 409 W Perry St
- 321 W Perry St
- 415 W Jackson St
Your Personal Tour Guide
Ask me questions while you tour the home.