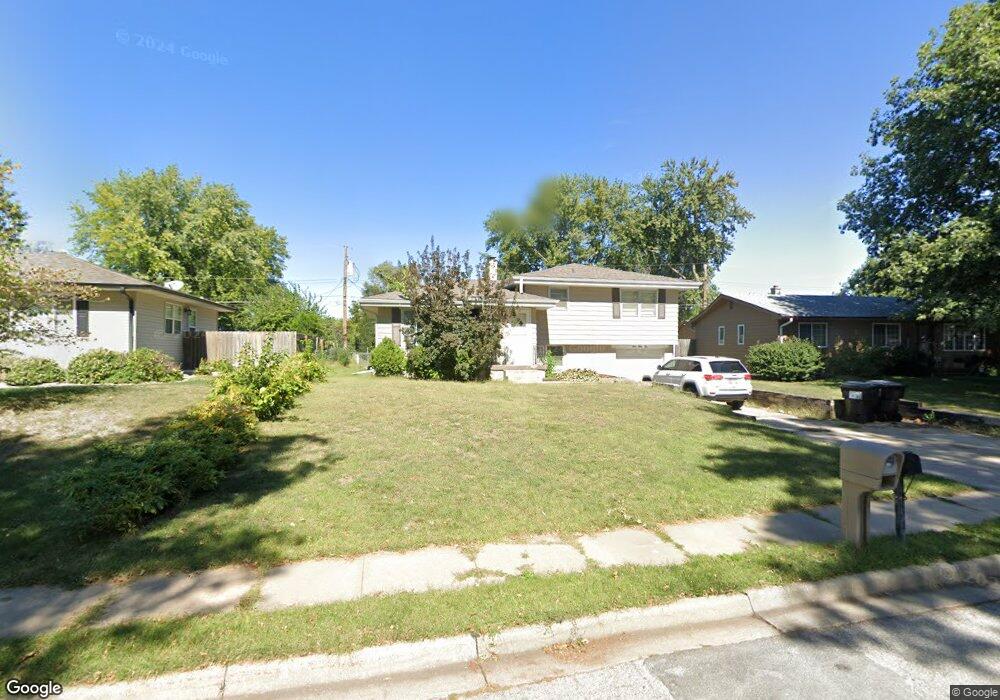
334 W Westplains Rd Gretna, NE 68028
Estimated Value: $176,000 - $253,000
3
Beds
3
Baths
1,430
Sq Ft
$152/Sq Ft
Est. Value
About This Home
This home is located at 334 W Westplains Rd, Gretna, NE 68028 and is currently estimated at $217,630, approximately $152 per square foot. 334 W Westplains Rd is a home located in Sarpy County with nearby schools including Gretna Elementary School, Gretna Middle School, and Gretna High School.
Ownership History
Date
Name
Owned For
Owner Type
Purchase Details
Closed on
May 22, 2023
Sold by
Chapman Sterling T and Chapman Mary J
Bought by
Chapman Living Trust
Current Estimated Value
Purchase Details
Closed on
Nov 7, 2007
Sold by
Federal Home Loan Mortgage Corporation
Bought by
Chapman Sterling T and Chapman Mary J
Home Financials for this Owner
Home Financials are based on the most recent Mortgage that was taken out on this home.
Original Mortgage
$76,000
Interest Rate
6.4%
Mortgage Type
Purchase Money Mortgage
Purchase Details
Closed on
Aug 8, 2007
Sold by
Richey Sean M and Richey Judy L
Bought by
Federal Home Loan Mortgage Corporation
Purchase Details
Closed on
Sep 26, 2005
Sold by
Blewett Patrick A and Blewett Jana L
Bought by
Richey Sean M and Richey Judy L
Home Financials for this Owner
Home Financials are based on the most recent Mortgage that was taken out on this home.
Original Mortgage
$112,005
Interest Rate
5.65%
Mortgage Type
Fannie Mae Freddie Mac
Create a Home Valuation Report for This Property
The Home Valuation Report is an in-depth analysis detailing your home's value as well as a comparison with similar homes in the area
Home Values in the Area
Average Home Value in this Area
Purchase History
| Date | Buyer | Sale Price | Title Company |
|---|---|---|---|
| Chapman Living Trust | -- | None Listed On Document | |
| Chapman Sterling T | $95,000 | Transcontinental Title Co | |
| Federal Home Loan Mortgage Corporation | $119,580 | None Available | |
| Richey Sean M | $118,000 | -- |
Source: Public Records
Mortgage History
| Date | Status | Borrower | Loan Amount |
|---|---|---|---|
| Previous Owner | Chapman Sterling T | $76,000 | |
| Previous Owner | Richey Sean M | $112,005 |
Source: Public Records
Tax History Compared to Growth
Tax History
| Year | Tax Paid | Tax Assessment Tax Assessment Total Assessment is a certain percentage of the fair market value that is determined by local assessors to be the total taxable value of land and additions on the property. | Land | Improvement |
|---|---|---|---|---|
| 2025 | $3,332 | $196,279 | $36,000 | $160,279 |
| 2024 | $3,212 | $183,489 | $33,000 | $150,489 |
| 2023 | $3,212 | $149,434 | $28,000 | $121,434 |
| 2022 | $3,370 | $147,684 | $26,000 | $121,684 |
| 2021 | $3,088 | $136,869 | $26,000 | $110,869 |
| 2020 | $2,830 | $126,159 | $26,000 | $100,159 |
| 2019 | $2,698 | $120,413 | $26,000 | $94,413 |
| 2018 | $2,500 | $112,079 | $19,000 | $93,079 |
| 2017 | $2,376 | $106,392 | $19,000 | $87,392 |
| 2016 | $2,275 | $102,140 | $19,000 | $83,140 |
| 2015 | $2,205 | $99,819 | $19,000 | $80,819 |
| 2014 | $2,197 | $100,326 | $19,000 | $81,326 |
| 2012 | -- | $100,728 | $19,000 | $81,728 |
Source: Public Records
Map
Nearby Homes
- 213 Highland Dr
- 347 Michael Dr
- 710 Pawnee Dr
- 11303 S 210th Ave
- Lot 127 W Gruenther Rd
- Lot 111 W Gruenther Rd
- TBD Lot 64 W Gruenther Rd
- 326 Connor St
- 20919 Mcclellan Cir
- 20717 Frances St
- Lot 136 W Gruenther Rd
- Lot 80 W Gruenther Rd
- Lot 71 W Gruenther Rd
- 11647 Willow Park Dr
- 21733 Parkview Dr
- 21710 Parkview Dr
- 21603 Parkview Dr
- 22111 Hackberry Dr
- 21715 Amber Dr
- 21906 Amber Dr
- 334 W Westplains Rd
- 338 W Westplains Rd
- 330 W Westplains Rd
- 342 W Westplains Rd
- 335 Highland Dr
- 324 W Westplains Rd
- 331 Highland Dr
- 339 Highland Dr
- 335 W Westplains Rd
- 331 W Westplains Rd
- 339 W Westplains Rd
- 323 Highland Dr
- 343 Highland Dr
- 346 W Westplains Rd
- 343 W Westplains Rd
- 316 W Westplains Rd
- 323 W Westplains Rd
- 317 Highland Dr
- 347 Highland Dr
- 313 Highland Dr