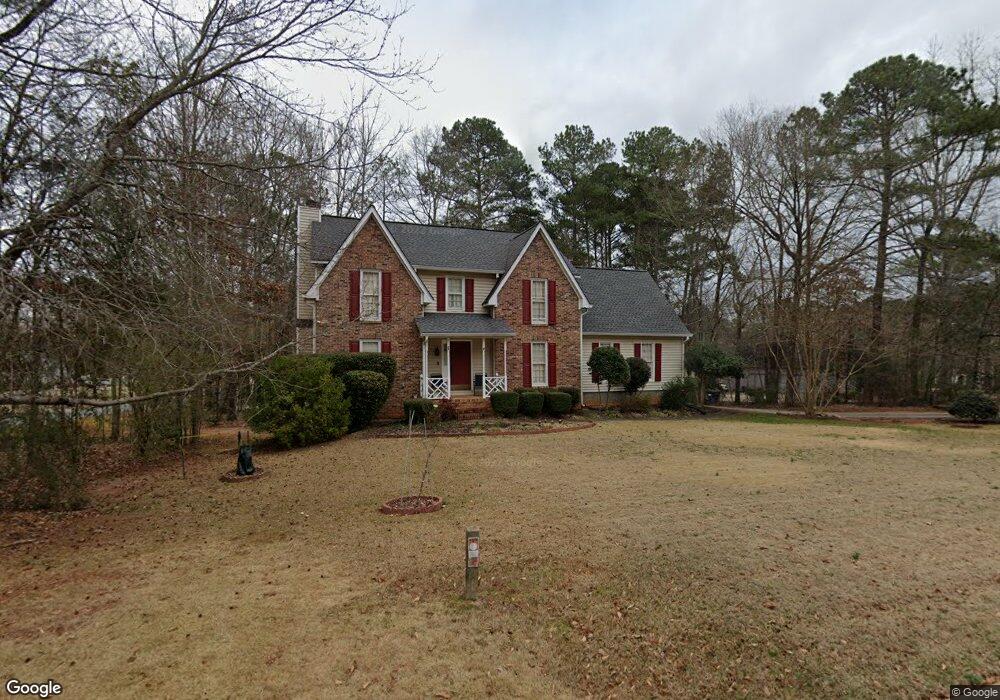
334 Walnut Grove Rd Peachtree City, GA 30269
Estimated Value: $525,000 - $563,000
--
Bed
--
Bath
2,157
Sq Ft
$253/Sq Ft
Est. Value
About This Home
This home is located at 334 Walnut Grove Rd, Peachtree City, GA 30269 and is currently estimated at $545,569, approximately $252 per square foot. 334 Walnut Grove Rd is a home located in Fayette County with nearby schools including Peachtree City Elementary School, Booth Middle School, and McIntosh High School.
Ownership History
Date
Name
Owned For
Owner Type
Purchase Details
Closed on
Jan 17, 2006
Sold by
Pham Christopher C and Pham Maeval A
Bought by
Zegalla Justin J and Lukehart Bethany
Current Estimated Value
Home Financials for this Owner
Home Financials are based on the most recent Mortgage that was taken out on this home.
Original Mortgage
$198,800
Outstanding Balance
$104,890
Interest Rate
5.25%
Mortgage Type
Stand Alone Second
Estimated Equity
$440,679
Purchase Details
Closed on
Aug 15, 1996
Sold by
Allen Ben R Margie W
Bought by
Pham Christopher Maeval
Purchase Details
Closed on
Jul 30, 1993
Sold by
Graves Richard S Diane F
Bought by
Allen Ben R Margie W
Home Financials for this Owner
Home Financials are based on the most recent Mortgage that was taken out on this home.
Original Mortgage
$90,000
Interest Rate
7.34%
Create a Home Valuation Report for This Property
The Home Valuation Report is an in-depth analysis detailing your home's value as well as a comparison with similar homes in the area
Home Values in the Area
Average Home Value in this Area
Purchase History
| Date | Buyer | Sale Price | Title Company |
|---|---|---|---|
| Zegalla Justin J | $240,500 | -- | |
| Pham Christopher Maeval | $175,000 | -- | |
| Allen Ben R Margie W | $153,900 | -- |
Source: Public Records
Mortgage History
| Date | Status | Borrower | Loan Amount |
|---|---|---|---|
| Open | Zegalla Justin J | $198,800 | |
| Previous Owner | Allen Ben R Margie W | $90,000 | |
| Closed | Pham Christopher Maeval | $0 |
Source: Public Records
Tax History Compared to Growth
Tax History
| Year | Tax Paid | Tax Assessment Tax Assessment Total Assessment is a certain percentage of the fair market value that is determined by local assessors to be the total taxable value of land and additions on the property. | Land | Improvement |
|---|---|---|---|---|
| 2024 | $4,635 | $194,288 | $38,000 | $156,288 |
| 2023 | $3,962 | $173,000 | $38,000 | $135,000 |
| 2022 | $4,348 | $167,520 | $38,000 | $129,520 |
| 2021 | $4,123 | $148,480 | $25,600 | $122,880 |
| 2020 | $4,223 | $137,960 | $25,600 | $112,360 |
| 2019 | $4,080 | $132,080 | $25,600 | $106,480 |
| 2018 | $4,133 | $131,660 | $24,700 | $106,960 |
| 2017 | $3,856 | $122,180 | $24,700 | $97,480 |
| 2016 | $3,604 | $110,220 | $24,700 | $85,520 |
| 2015 | $3,216 | $96,980 | $24,700 | $72,280 |
| 2014 | $3,098 | $91,940 | $24,700 | $67,240 |
| 2013 | -- | $89,900 | $0 | $0 |
Source: Public Records
Map
Nearby Homes
- 327 Walnut Grove Rd
- 405 Sherrels Ford
- 109 Denham Square Unit I
- 637 N Fairfield Dr
- 308 Bandon Way
- 505 N Fairfield Dr
- 826 Richmond Cir
- 111 S Fairfield Dr
- 713 S Fairfield Dr
- 210 Bandon Way
- 101 Eadestowne Way
- 440 Bandon Way
- 105 Bandon Way
- 102 Bandon Way
- 400 Pinegate Rd
- 103 Creek Bed Ct
- 103 Chipstone Ct
- 412 Constitution Cir
- 206 Roundwood Way
- 104 Appleseed Ct
- 202 Melrah Hill
- 330 Walnut Grove Rd
- 345 Walnut Grove Rd
- 347 Walnut Grove Rd
- 343 Walnut Grove Rd
- 204 Melrah Hill
- 328 Walnut Grove Rd
- 101 Adell Ct
- 401 Walnut Grove Rd
- 341 Walnut Grove Rd
- 341 Walnut Grove Rd Unit 71
- 0 Adell Ct
- 339 Walnut Grove Rd
- 402 Walnut Grove Rd
- 206 Melrah Hill
- 337 Walnut Grove Rd
- 326 Walnut Grove Rd
- 403 Walnut Grove Rd
- 103 Adell Ct
- 100 Adell Ct