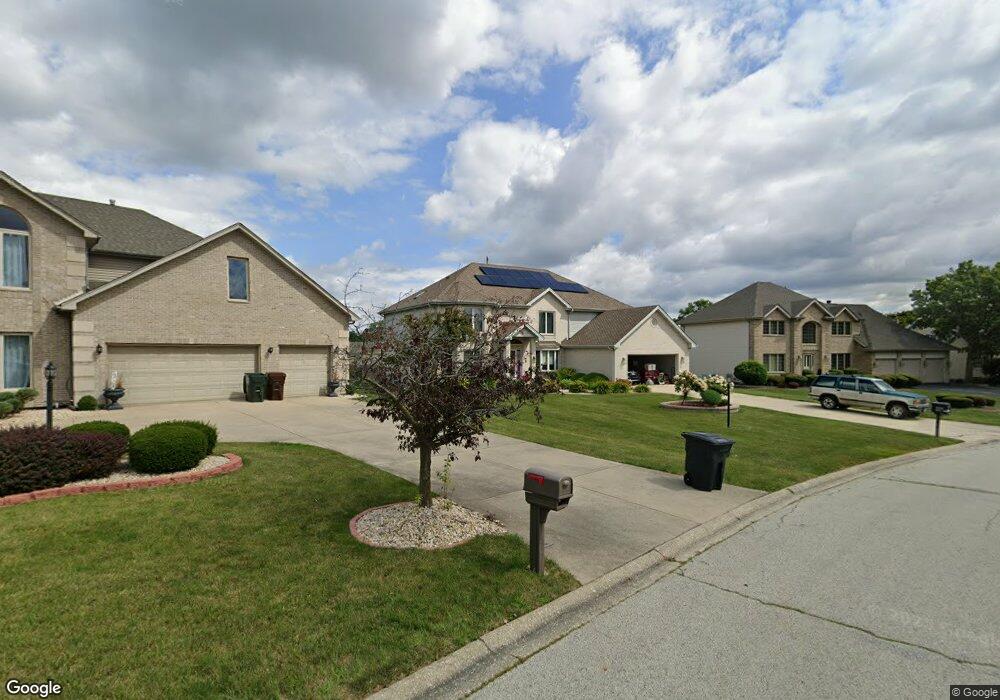
3341 Oregon Trail Olympia Fields, IL 60461
Estimated Value: $436,333 - $485,000
4
Beds
3
Baths
3,634
Sq Ft
$129/Sq Ft
Est. Value
About This Home
This home is located at 3341 Oregon Trail, Olympia Fields, IL 60461 and is currently estimated at $467,083, approximately $128 per square foot. 3341 Oregon Trail is a home located in Cook County with nearby schools including Illinois School, Arcadia Elementary School, and Indiana Elementary School.
Ownership History
Date
Name
Owned For
Owner Type
Purchase Details
Closed on
Feb 25, 2012
Sold by
Mangum Sharon and Mangum George R
Bought by
Standard Bank & Trust Company and Trust #21166
Current Estimated Value
Purchase Details
Closed on
Oct 6, 1994
Sold by
Glen Ridge Builders Inc
Bought by
Yokley Sharon
Home Financials for this Owner
Home Financials are based on the most recent Mortgage that was taken out on this home.
Original Mortgage
$251,200
Interest Rate
7.9%
Purchase Details
Closed on
Mar 24, 1994
Sold by
American National Bk & Tr Co Of Chicago
Bought by
Glen Ridge Builders Inc
Home Financials for this Owner
Home Financials are based on the most recent Mortgage that was taken out on this home.
Original Mortgage
$196,000
Interest Rate
8.41%
Create a Home Valuation Report for This Property
The Home Valuation Report is an in-depth analysis detailing your home's value as well as a comparison with similar homes in the area
Home Values in the Area
Average Home Value in this Area
Purchase History
| Date | Buyer | Sale Price | Title Company |
|---|---|---|---|
| Standard Bank & Trust Company | -- | None Available | |
| Yokley Sharon | $54,000 | -- | |
| Glen Ridge Builders Inc | $264,500 | -- |
Source: Public Records
Mortgage History
| Date | Status | Borrower | Loan Amount |
|---|---|---|---|
| Previous Owner | Yokley Sharon | $251,200 | |
| Previous Owner | Glen Ridge Builders Inc | $196,000 |
Source: Public Records
Tax History
| Year | Tax Paid | Tax Assessment Tax Assessment Total Assessment is a certain percentage of the fair market value that is determined by local assessors to be the total taxable value of land and additions on the property. | Land | Improvement |
|---|---|---|---|---|
| 2025 | $13,504 | $34,504 | $5,977 | $28,527 |
| 2024 | $13,504 | $34,504 | $5,977 | $28,527 |
| 2023 | $12,109 | $37,000 | $5,977 | $31,023 |
| 2022 | $12,109 | $27,480 | $6,642 | $20,838 |
| 2021 | $13,609 | $27,478 | $6,641 | $20,837 |
| 2020 | $12,558 | $27,478 | $6,641 | $20,837 |
| 2019 | $13,512 | $29,214 | $5,977 | $23,237 |
| 2018 | $13,413 | $29,214 | $5,977 | $23,237 |
| 2017 | $12,997 | $29,214 | $5,977 | $23,237 |
| 2016 | $12,980 | $28,345 | $5,313 | $23,032 |
| 2015 | $12,875 | $28,345 | $5,313 | $23,032 |
| 2014 | $12,611 | $28,345 | $5,313 | $23,032 |
| 2013 | $10,718 | $26,645 | $5,313 | $21,332 |
Source: Public Records
Map
Nearby Homes
- 3415 Vollmer Rd Unit 308
- 3507 Park Place
- 3427 Vollmer Rd Unit 205
- 3427 Vollmer Rd Unit 202
- 3427 Vollmer Rd Unit 209
- 3451 Ithaca Rd
- 3506 Ithaca Rd
- 1816 Quail Ct
- 2904 Athena Ct
- 2908 Athena Ct
- 20001 Arquilla Cir
- 20015 Delphi Dr
- 20415 Doria Ln
- 20436 Arcadian Dr
- 1437 Woodhollow Dr
- 1429 Woodhollow Dr Unit 2
- 2937 Kathleen Ln
- 1450 Tanglewood St Unit 1B
- 20535 Marathon Ct
- 19611 Crawford Ave
- 3335 Oregon Trail
- 20012 Oregon Trail
- 3329 Oregon Trail
- 20018 Oregon Trail
- 3336 Oregon Trail
- 20021 Oregon Trail
- 3323 Oregon Trail
- 3330 Oregon Trail
- 20024 Oregon Trail
- 20027 Oregon Trail
- 3317 Oregon Trail
- 20030 Oregon Trail
- 3318 Oregon Trail
- 20033 Oregon Trail
- 3311 Oregon Trail
- 20036 Oregon Trail
- 20012 Overland Trail
- 3305 Oregon Trail
- 20000 Governors Hwy
- 19950 Governors Hwy
Your Personal Tour Guide
Ask me questions while you tour the home.