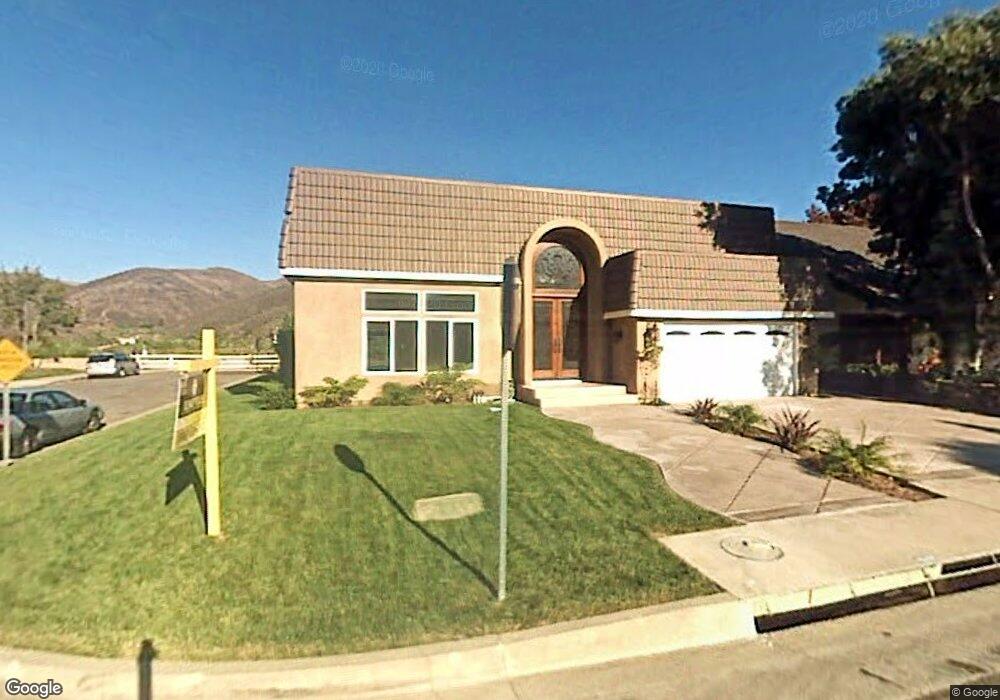
33432 Calle Miramar Unit 1 San Juan Capistrano, CA 92675
Estimated Value: $2,139,000 - $2,583,000
4
Beds
3
Baths
3,268
Sq Ft
$701/Sq Ft
Est. Value
About This Home
This home is located at 33432 Calle Miramar Unit 1, San Juan Capistrano, CA 92675 and is currently estimated at $2,290,611, approximately $700 per square foot. 33432 Calle Miramar Unit 1 is a home located in Orange County with nearby schools including Palisades Elementary School, Shorecliffs Middle School, and San Juan Hills High School.
Ownership History
Date
Name
Owned For
Owner Type
Purchase Details
Closed on
Apr 22, 2008
Sold by
Ramos Everett R
Bought by
Gavin Sean and Gavin Jennifer C
Current Estimated Value
Home Financials for this Owner
Home Financials are based on the most recent Mortgage that was taken out on this home.
Original Mortgage
$525,000
Outstanding Balance
$330,828
Interest Rate
5.87%
Mortgage Type
Unknown
Estimated Equity
$1,959,783
Purchase Details
Closed on
Aug 10, 2005
Sold by
Ramos Laura Perez
Bought by
Ramos Everett Rea
Home Financials for this Owner
Home Financials are based on the most recent Mortgage that was taken out on this home.
Original Mortgage
$715,500
Interest Rate
6.77%
Mortgage Type
Purchase Money Mortgage
Purchase Details
Closed on
Jul 29, 2005
Sold by
Connelly Daniel J and Connelly Julia H
Bought by
Ramos Everett R
Home Financials for this Owner
Home Financials are based on the most recent Mortgage that was taken out on this home.
Original Mortgage
$715,500
Interest Rate
6.77%
Mortgage Type
Purchase Money Mortgage
Create a Home Valuation Report for This Property
The Home Valuation Report is an in-depth analysis detailing your home's value as well as a comparison with similar homes in the area
Home Values in the Area
Average Home Value in this Area
Purchase History
| Date | Buyer | Sale Price | Title Company |
|---|---|---|---|
| Gavin Sean | $1,010,000 | Ortc | |
| Ramos Everett Rea | -- | Equity Title Company | |
| Ramos Everett R | $795,000 | Equity Title Company |
Source: Public Records
Mortgage History
| Date | Status | Borrower | Loan Amount |
|---|---|---|---|
| Open | Gavin Sean | $525,000 | |
| Previous Owner | Ramos Everett R | $715,500 |
Source: Public Records
Tax History Compared to Growth
Tax History
| Year | Tax Paid | Tax Assessment Tax Assessment Total Assessment is a certain percentage of the fair market value that is determined by local assessors to be the total taxable value of land and additions on the property. | Land | Improvement |
|---|---|---|---|---|
| 2025 | $19,526 | $1,907,400 | $1,604,822 | $302,578 |
| 2024 | $19,526 | $1,870,000 | $1,573,354 | $296,646 |
| 2023 | $10,246 | $967,919 | $633,967 | $333,952 |
| 2022 | $9,790 | $948,941 | $621,537 | $327,404 |
| 2021 | $9,610 | $930,335 | $609,350 | $320,985 |
| 2020 | $9,525 | $920,796 | $603,102 | $317,694 |
| 2019 | $9,349 | $902,742 | $591,277 | $311,465 |
| 2018 | $9,182 | $885,042 | $579,684 | $305,358 |
| 2017 | $9,098 | $867,689 | $568,318 | $299,371 |
| 2016 | $8,931 | $850,676 | $557,175 | $293,501 |
| 2015 | $8,795 | $837,899 | $548,806 | $289,093 |
| 2014 | -- | $821,486 | $538,055 | $283,431 |
Source: Public Records
Map
Nearby Homes
- 27171 Calle Delgado
- 33471 Calle Miramar
- 33575 Via de Agua
- 33801 Glocamora Ln
- 33792 Kinkerry Ln
- 33531 Paseo Eternidad
- 28101 Pacifica Del Mar
- 26661 Paseo Callado
- 26572 Paseo Callado
- 32802 Valle Rd Unit 108
- 32802 Valle Rd Unit 53
- 32802 Valle Rd Unit 135
- 27369 Paseo Placentia Unit 31
- 27477 Paseo Amador
- 27369 Paseo la Serna
- 27485 Paseo Amador Unit 5
- 3807 Via Manzana
- 34240 Camino el Molino
- 27151 Via Chicuelina Unit B
- 26591 Via California
- 33432 Calle Miramar
- 33442 Calle Miramar
- 33462 Calle Miramar
- 27201 Calle Delgado
- 33431 Calle Miramar
- 33466 Calle Miramar
- 27191 Calle Delgado
- 33441 Calle Miramar
- 33461 Calle Miramar
- 33482 Calle Miramar
- 27161 Calle Delgado
- 33432 Via de Agua
- 33496 Calle Miramar
- 33452 Via de Agua
- 33491 Calle Miramar
- 27151 Calle Delgado
- 33462 Via de Agua
- 33506 Calle Miramar
- 33382 Via de Agua
- 33501 Calle Miramar