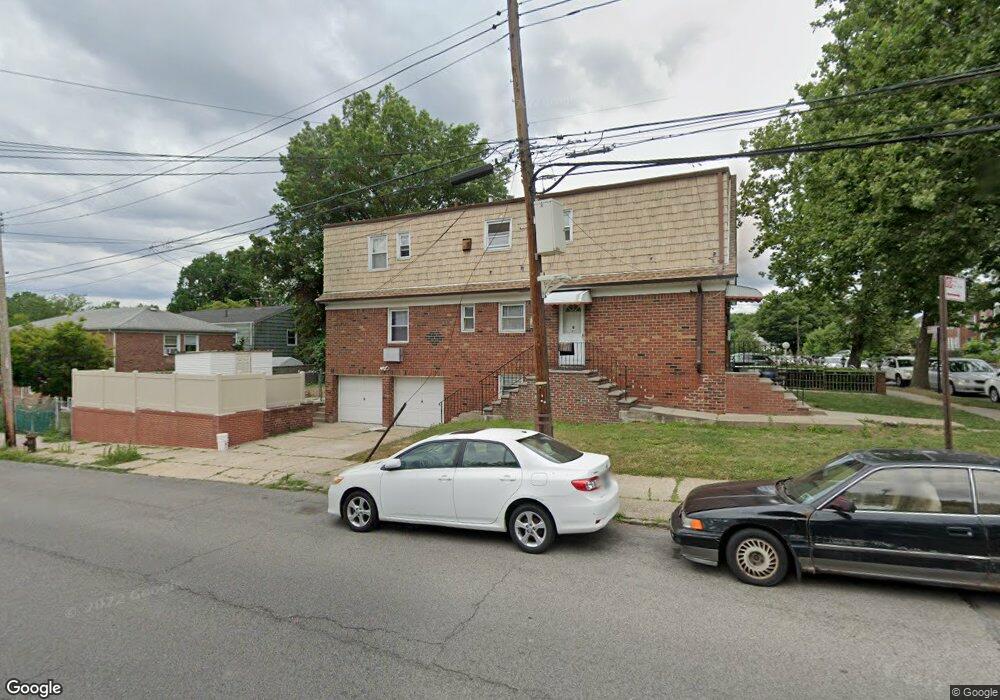
3344 149th Place Flushing, NY 11354
Flushing NeighborhoodEstimated Value: $1,480,000 - $1,693,000
3
Beds
4
Baths
3,055
Sq Ft
$517/Sq Ft
Est. Value
About This Home
This home is located at 3344 149th Place, Flushing, NY 11354 and is currently estimated at $1,578,666, approximately $516 per square foot. 3344 149th Place is a home located in Queens County with nearby schools including P.S. 21 Edward Hart, Jhs 185 Edward Bleeker, and Flushing High School.
Ownership History
Date
Name
Owned For
Owner Type
Purchase Details
Closed on
Apr 21, 2021
Sold by
Chen Kaiwu and Chen Zuo
Bought by
Li Tingting and Wang Chun Biao
Current Estimated Value
Home Financials for this Owner
Home Financials are based on the most recent Mortgage that was taken out on this home.
Original Mortgage
$702,000
Outstanding Balance
$634,833
Interest Rate
3.1%
Mortgage Type
Purchase Money Mortgage
Estimated Equity
$943,833
Purchase Details
Closed on
Dec 2, 2015
Sold by
Hui1380 Llc
Bought by
Chen Kaiwu and Chen Zuo
Home Financials for this Owner
Home Financials are based on the most recent Mortgage that was taken out on this home.
Original Mortgage
$539,000
Interest Rate
3.89%
Purchase Details
Closed on
Jun 24, 2015
Sold by
Estate Of Emily Nittoli
Bought by
Hui1380 Llc
Home Financials for this Owner
Home Financials are based on the most recent Mortgage that was taken out on this home.
Original Mortgage
$100,000
Interest Rate
3.87%
Mortgage Type
New Conventional
Create a Home Valuation Report for This Property
The Home Valuation Report is an in-depth analysis detailing your home's value as well as a comparison with similar homes in the area
Home Values in the Area
Average Home Value in this Area
Purchase History
| Date | Buyer | Sale Price | Title Company |
|---|---|---|---|
| Li Tingting | $1,205,000 | -- | |
| Chen Kaiwu | $980,000 | -- | |
| Hui1380 Llc | $880,000 | -- |
Source: Public Records
Mortgage History
| Date | Status | Borrower | Loan Amount |
|---|---|---|---|
| Open | Li Tingting | $702,000 | |
| Previous Owner | Chen Kaiwu | $539,000 | |
| Previous Owner | Hui1380 Llc | $100,000 |
Source: Public Records
Tax History Compared to Growth
Tax History
| Year | Tax Paid | Tax Assessment Tax Assessment Total Assessment is a certain percentage of the fair market value that is determined by local assessors to be the total taxable value of land and additions on the property. | Land | Improvement |
|---|---|---|---|---|
| 2025 | $11,231 | $59,268 | $12,097 | $47,171 |
| 2024 | $11,231 | $55,915 | $12,433 | $43,482 |
| 2023 | $10,595 | $52,751 | $9,960 | $42,791 |
| 2022 | $10,531 | $109,560 | $23,280 | $86,280 |
| 2021 | $11,017 | $96,180 | $23,280 | $72,900 |
| 2020 | $10,454 | $94,800 | $23,280 | $71,520 |
| 2019 | $9,747 | $81,180 | $23,280 | $57,900 |
| 2018 | $8,961 | $43,959 | $11,698 | $32,261 |
| 2017 | $8,961 | $43,959 | $15,866 | $28,093 |
| 2016 | $8,721 | $43,959 | $15,866 | $28,093 |
| 2015 | $2,062 | $41,158 | $17,810 | $23,348 |
| 2014 | $2,062 | $38,830 | $19,505 | $19,325 |
Source: Public Records
Map
Nearby Homes
- 33-42 150th St
- 34-21 148th St
- 149-29 35th Ave
- 14943 35th Ave Unit 5K
- 149-43 35 Ave Unit 3J
- 14808 35th Ave
- 148-04 35th Ave
- 14922 32nd Ave
- 32-19 149th St
- 35-10 150th St Unit 4
- 147-20 35th Ave Unit 11E
- 147-20 35th Ave Unit 9G
- 147-20 35th Ave Unit Ph1B
- 14809 Northern Blvd Unit 3N
- 14809 Northern Blvd Unit 5M
- 148-09 Northern Blvd Unit 4 L
- 148-09 Northern Blvd Unit 5B
- 148-09 Northern Blvd Unit 2B
- 148-09 Northern Blvd Unit 1J
- 148-09 Northern Blvd Unit 6
- 3344 149th Place
- 3340 149th Place
- 3334 149th Place
- 3402 149th Place
- 3337 149th St
- 34-02 149th Place
- 3337 149th St Unit 2 Fl
- 3337 149th St
- 3341 149th Place
- 3333 149th St
- 33-30 149th Place
- 34-09 149th St
- 3401 149th St
- 3406 149th Place
- 3330 149th Place
- 3333 149th Place
- 3331 149th St
- 3408 149th Place
- 3408 149th Place
- 3405 149th St