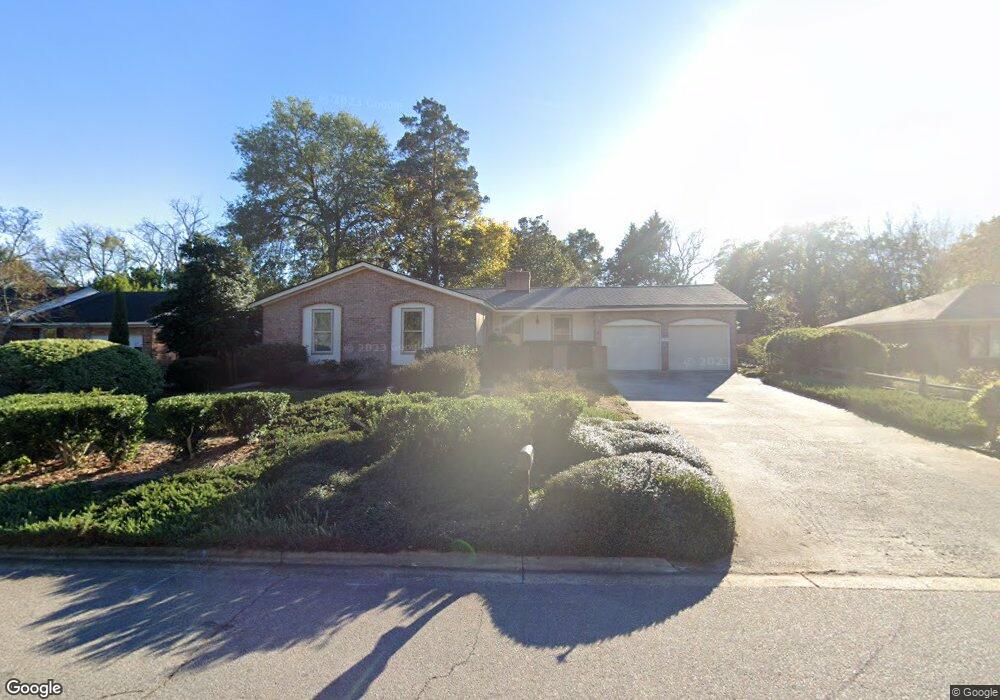
3344 Quaker Spring Rd Augusta, GA 30907
Montclair NeighborhoodEstimated Value: $242,203 - $281,000
3
Beds
2
Baths
1,894
Sq Ft
$140/Sq Ft
Est. Value
About This Home
This home is located at 3344 Quaker Spring Rd, Augusta, GA 30907 and is currently estimated at $265,051, approximately $139 per square foot. 3344 Quaker Spring Rd is a home located in Richmond County with nearby schools including Warren Road Elementary School, Tutt Middle School, and Johnson Magnet.
Ownership History
Date
Name
Owned For
Owner Type
Purchase Details
Closed on
Sep 2, 2022
Sold by
Dillenbeck Richard V
Bought by
Dillenbeck Richard V and Golden Jane Ann
Current Estimated Value
Purchase Details
Closed on
Mar 17, 2020
Sold by
Dillenbeck Richard V
Bought by
Dillenbeck Richard V and Golden Jane Ann
Purchase Details
Closed on
Apr 7, 1994
Sold by
Clark James W
Bought by
Dillenbeck Richard V
Purchase Details
Closed on
Mar 31, 1994
Sold by
Clark James W
Bought by
Dillenbeck Richard
Purchase Details
Closed on
Sep 14, 1993
Sold by
Clark Mary Faye Estate Of By Exr
Bought by
Clark James W
Purchase Details
Closed on
Sep 13, 1993
Sold by
Clark Mary Faye Est
Bought by
Clark James W
Purchase Details
Closed on
Oct 1, 1981
Create a Home Valuation Report for This Property
The Home Valuation Report is an in-depth analysis detailing your home's value as well as a comparison with similar homes in the area
Home Values in the Area
Average Home Value in this Area
Purchase History
| Date | Buyer | Sale Price | Title Company |
|---|---|---|---|
| Dillenbeck Richard V | -- | -- | |
| Dillenbeck Richard V | -- | -- | |
| Dillenbeck Richard V | -- | -- | |
| Dillenbeck Richard | $92,500 | -- | |
| Clark James W | -- | -- | |
| Clark James W | -- | -- | |
| -- | $65,000 | -- |
Source: Public Records
Tax History
| Year | Tax Paid | Tax Assessment Tax Assessment Total Assessment is a certain percentage of the fair market value that is determined by local assessors to be the total taxable value of land and additions on the property. | Land | Improvement |
|---|---|---|---|---|
| 2025 | $1,082 | $95,108 | $12,800 | $82,308 |
| 2024 | $1,082 | $104,948 | $12,800 | $92,148 |
| 2023 | $1,121 | $95,984 | $12,800 | $83,184 |
| 2022 | $901 | $66,300 | $12,800 | $53,500 |
| 2021 | $933 | $62,986 | $12,800 | $50,186 |
| 2020 | $940 | $62,986 | $12,800 | $50,186 |
| 2019 | $893 | $55,815 | $11,600 | $44,215 |
| 2018 | $898 | $55,815 | $11,600 | $44,215 |
| 2017 | $861 | $56,244 | $11,600 | $44,644 |
| 2016 | $861 | $56,244 | $11,600 | $44,644 |
| 2015 | $861 | $56,244 | $11,600 | $44,644 |
| 2014 | $891 | $56,244 | $11,600 | $44,644 |
Source: Public Records
Map
Nearby Homes
- 2319 Creek View Dr
- 3315 Sugar Mill Rd
- 2915 Running Creek Ln
- 2928 Running Creek Ln
- 422 Pleasant Home Rd
- 427 Shallowford Cir
- 429 Shallowford Cir
- 2944 Foxhall Cir
- 33 Londonberry Ln
- 3310 Sandpiper Ln
- 3223 Crane Ferry Rd
- 306 Pleasant Home Rd
- 306 Skylark Rd
- 3323 Ravenwood Dr
- 203 Buckhead Ct
- 3322 Sandpiper Ln
- 333 Indian Trail
- 3319 Thread Needle Rd W
- 2921 Foxhall Cir
- 2208 Pleasant Dr
- 3342 Quaker Spring Rd
- 3346 Quaker Spring Rd
- 3308 Sugar Mill Rd
- 3306 Sugar Mill Rd
- 3340 Quaker Spring Rd
- 3343 Quaker Spring Rd
- 3310 Sugar Mill Rd
- 3348 Quaker Spring Rd
- 3304 Sugar Mill Rd
- 3345 Quaker Spring Rd
- 3341 Quaker Spring Rd
- 3339 Quaker Spring Rd
- 3347 Quaker Spring Rd
- 3339 Quaker Spring Rd
- 3338 Quaker Spring Rd
- 3302 Sugar Mill Rd
- 3312 Sugar Mill Rd
- 3309 Sugar Mill Rd
- 2902 Pleasant Cove Ct
- 3337 Quaker Spring Rd
Your Personal Tour Guide
Ask me questions while you tour the home.