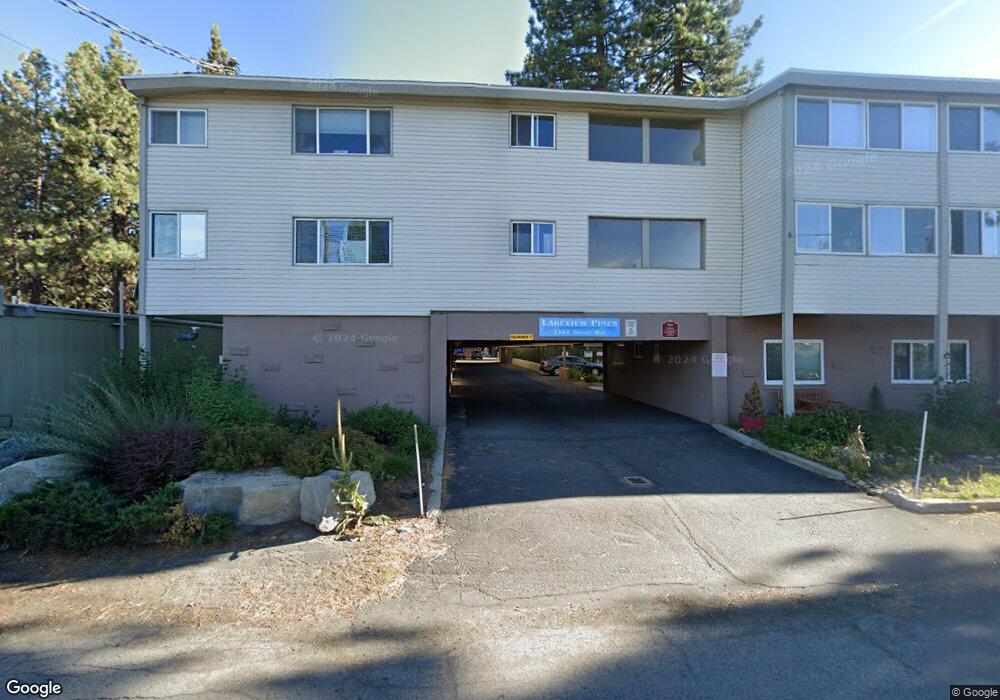
3344 Sandy Way Unit 33 South Lake Tahoe, CA 96150
Estimated Value: $313,000 - $426,000
2
Beds
1
Bath
812
Sq Ft
$439/Sq Ft
Est. Value
About This Home
This home is located at 3344 Sandy Way Unit 33, South Lake Tahoe, CA 96150 and is currently estimated at $356,140, approximately $438 per square foot. 3344 Sandy Way Unit 33 is a home located in El Dorado County with nearby schools including Bijou Community, South Tahoe Middle School, and South Tahoe High School.
Ownership History
Date
Name
Owned For
Owner Type
Purchase Details
Closed on
Mar 21, 2018
Sold by
Pot4 Llc
Bought by
Hutchings Luanne M Nunes and Hutchings Bruce R
Current Estimated Value
Purchase Details
Closed on
Jan 30, 2018
Sold by
Suzanne O Toole Richard A and Toole Suzanne O
Bought by
Potu Llc
Purchase Details
Closed on
Jun 25, 2009
Sold by
Deming Bryan and Deming Tracie
Bought by
Otoole Richard A and Otoole Suzanne C
Purchase Details
Closed on
Nov 24, 2004
Sold by
Lemming Richard W and Lemming Sunny Kay
Bought by
Deming Bryan and Deming Tracie
Purchase Details
Closed on
Feb 22, 2001
Sold by
Riley Frank E and Riley Barbara
Bought by
Lemming Richard W and Lemming Sunny Kay
Home Financials for this Owner
Home Financials are based on the most recent Mortgage that was taken out on this home.
Original Mortgage
$86,000
Interest Rate
6.98%
Create a Home Valuation Report for This Property
The Home Valuation Report is an in-depth analysis detailing your home's value as well as a comparison with similar homes in the area
Home Values in the Area
Average Home Value in this Area
Purchase History
| Date | Buyer | Sale Price | Title Company |
|---|---|---|---|
| Hutchings Luanne M Nunes | $100,500 | None Available | |
| Potu Llc | $190,000 | Old Republic Title Company | |
| Otoole Richard A | $164,000 | Fidelity Natl Title Co Of Ca | |
| Deming Bryan | $246,000 | Placer Title Co | |
| Lemming Richard W | $107,500 | Old Republic Title Company |
Source: Public Records
Mortgage History
| Date | Status | Borrower | Loan Amount |
|---|---|---|---|
| Previous Owner | Lemming Richard W | $86,000 | |
| Closed | Lemming Richard W | $16,125 |
Source: Public Records
Tax History Compared to Growth
Tax History
| Year | Tax Paid | Tax Assessment Tax Assessment Total Assessment is a certain percentage of the fair market value that is determined by local assessors to be the total taxable value of land and additions on the property. | Land | Improvement |
|---|---|---|---|---|
| 2025 | $2,342 | $216,176 | $64,850 | $151,326 |
| 2024 | $2,342 | $211,938 | $63,579 | $148,359 |
| 2023 | $2,296 | $207,783 | $62,333 | $145,450 |
| 2022 | $2,280 | $203,710 | $61,111 | $142,599 |
| 2021 | $2,245 | $199,716 | $59,913 | $139,803 |
| 2020 | $2,213 | $197,669 | $59,299 | $138,370 |
| 2019 | $2,202 | $193,794 | $58,137 | $135,657 |
| 2018 | $1,808 | $158,000 | $29,000 | $129,000 |
| 2017 | $1,813 | $158,000 | $29,000 | $129,000 |
| 2016 | $1,702 | $148,000 | $27,000 | $121,000 |
| 2015 | $1,709 | $148,000 | $27,000 | $121,000 |
| 2014 | $1,544 | $136,000 | $27,000 | $109,000 |
Source: Public Records
Map
Nearby Homes
- 3342 Treehaven Dr
- 3338 Treehaven Dr
- 3334 Treehaven Dr
- 1101 Johnson Blvd
- 1022 Fairway Ave
- 3339 Cape Horn Rd
- 3520 Cloverdale Ave
- 920 Balbijou Rd Unit 229
- 1079 Glenwood Way
- 1115 Glenwood Way
- 1048 Trout Creek Ave
- 3275 Marlette Cir
- 952 San Jose Ave
- 960 San Francisco Ave
- 1151 Herbert Ave Unit B
- 3535 Lake Tahoe Blvd Unit 499
- 3535 Lake Tahoe Blvd Unit 131
- 3535 Lake Tahoe Blvd Unit 623
- 3535 Lake Tahoe Blvd Unit 130
- 3535 Lake Tahoe Blvd Unit 313
- 3344 Sandy Way
- 3344 Sandy Way Unit 19
- 3344 Sandy Way Unit 18
- 3344 Sandy Way Unit 17
- 3344 Sandy Way Unit 16
- 3344 Sandy Way Unit 15
- 3344 Sandy Way Unit 14
- 3344 Sandy Way Unit 12
- 3344 Sandy Way Unit 11
- 3344 Sandy Way Unit 10
- 3344 Sandy Way Unit 9
- 3344 Sandy Way Unit 8
- 3344 Sandy Way Unit 7
- 3344 Sandy Way Unit 6
- 3344 Sandy Way Unit 5
- 3344 Sandy Way Unit 4
- 3344 Sandy Way Unit 3
- 3344 Sandy Way Unit 2
- 3344 Sandy Way Unit 1
- 3344 Sandy Way Unit A