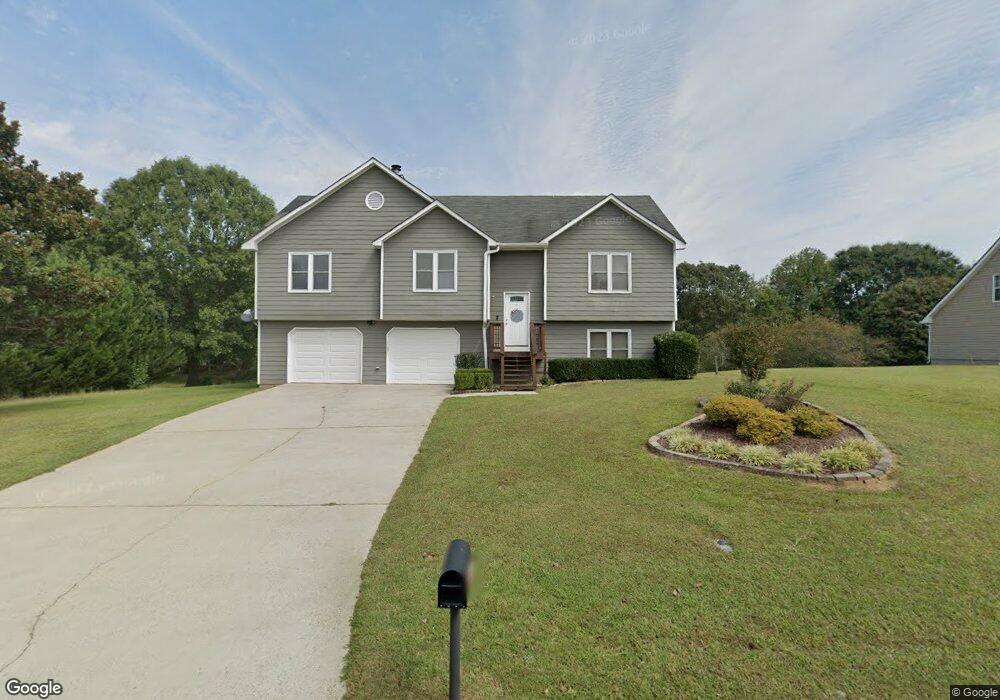
3344 Windgate Dr Buford, GA 30519
Estimated Value: $360,000 - $378,000
3
Beds
2
Baths
1,566
Sq Ft
$236/Sq Ft
Est. Value
About This Home
This home is located at 3344 Windgate Dr, Buford, GA 30519 and is currently estimated at $369,230, approximately $235 per square foot. 3344 Windgate Dr is a home located in Hall County with nearby schools including Friendship Elementary School, C.W. Davis Middle School, and Flowery Branch High School.
Ownership History
Date
Name
Owned For
Owner Type
Purchase Details
Closed on
Feb 4, 2011
Sold by
Peacock Deborah G and Peacock Richard W
Bought by
Peacock Richard W and Peacock Deborah G
Current Estimated Value
Home Financials for this Owner
Home Financials are based on the most recent Mortgage that was taken out on this home.
Original Mortgage
$75,200
Outstanding Balance
$1,168
Interest Rate
4.82%
Mortgage Type
New Conventional
Estimated Equity
$368,062
Purchase Details
Closed on
Jan 31, 1994
Sold by
Premier Home Builders Inc
Bought by
Peacock Deborah G Richard
Home Financials for this Owner
Home Financials are based on the most recent Mortgage that was taken out on this home.
Original Mortgage
$80,650
Interest Rate
7.17%
Purchase Details
Closed on
Aug 1, 1993
Create a Home Valuation Report for This Property
The Home Valuation Report is an in-depth analysis detailing your home's value as well as a comparison with similar homes in the area
Home Values in the Area
Average Home Value in this Area
Purchase History
| Date | Buyer | Sale Price | Title Company |
|---|---|---|---|
| Peacock Richard W | -- | -- | |
| Peacock Deborah G Richard | $84,900 | -- | |
| -- | $49,500 | -- |
Source: Public Records
Mortgage History
| Date | Status | Borrower | Loan Amount |
|---|---|---|---|
| Open | Peacock Richard W | $75,200 | |
| Previous Owner | Peacock Deborah G Richard | $80,650 |
Source: Public Records
Tax History
| Year | Tax Paid | Tax Assessment Tax Assessment Total Assessment is a certain percentage of the fair market value that is determined by local assessors to be the total taxable value of land and additions on the property. | Land | Improvement |
|---|---|---|---|---|
| 2025 | $2,676 | $151,440 | $28,680 | $122,760 |
| 2024 | $3,337 | $131,920 | $20,840 | $111,080 |
| 2023 | $2,818 | $126,640 | $20,840 | $105,800 |
| 2022 | $2,828 | $106,840 | $20,840 | $86,000 |
| 2021 | $2,627 | $97,200 | $17,920 | $79,280 |
| 2020 | $2,390 | $85,720 | $13,160 | $72,560 |
| 2019 | $2,279 | $80,920 | $13,160 | $67,760 |
| 2018 | $1,701 | $57,840 | $7,160 | $50,680 |
| 2017 | $907 | $29,971 | $5,040 | $24,931 |
| 2016 | $887 | $29,971 | $5,040 | $24,931 |
| 2015 | $891 | $29,971 | $5,040 | $24,931 |
| 2014 | $891 | $29,971 | $5,040 | $24,931 |
Source: Public Records
Map
Nearby Homes
- 4446 Hosch Reserve Dr
- 4456 Hosch Reserve Dr
- 4416 Hosch Reserve Dr
- 4447 Hosch Reserve Dr
- 3161 Keenly Ives Ct
- 3208 Goldberry St
- 4437 Hosch Reserve Dr
- 4436 Hosch Reserve Dr
- 3111 Old Thompson Mill Rd
- 3431 High Shoals
- 3300 Old Thompson Mill Rd
- 2908 Perimeter Cir
- 3378 Long Creek Dr
- 3382 Long Creek Dr
- 2747 Pearl Ridge Trace
- 3507 Creek Hollow
- 2824 Pleasant Oak Dr
- 7343 Peacebrook Dr
- 6369 Aarons Way
- 7389 Williams Rd
- 3348 Windgate Dr
- 3340 Windgate Dr
- 3349 Windgate Dr
- 3343 Windgate Dr
- 3339 Windpointe Ct
- 3333 Windgate Dr
- 3352 Windgate Dr
- 3356 Windgate Dr
- 3321 Windgate Dr
- 3342 Windpointe Ct
- 3334 Windgate Dr Unit 41
- 3334 Windgate Dr
- 3357 Windgate Dr
- 3338 Windpointe Ct Unit 42
- 3338 Windpointe Ct
- 3360 Windgate Dr
- 3301 Windgate Dr
- 3313 Windward Gate Ln
- 3299 Windgate Dr
- 3324 Windgate Dr
Your Personal Tour Guide
Ask me questions while you tour the home.