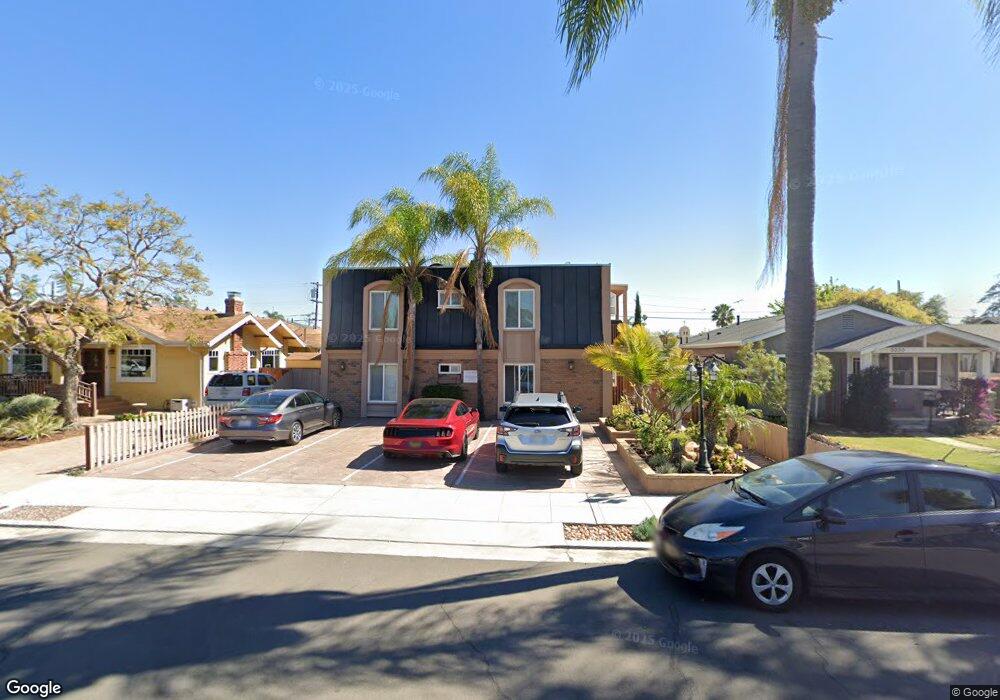
3345 29th St Unit 7 San Diego, CA 92104
North Park NeighborhoodEstimated Value: $432,431 - $574,000
1
Bed
1
Bath
540
Sq Ft
$938/Sq Ft
Est. Value
About This Home
This home is located at 3345 29th St Unit 7, San Diego, CA 92104 and is currently estimated at $506,358, approximately $937 per square foot. 3345 29th St Unit 7 is a home located in San Diego County with nearby schools including Jefferson Elementary, Roosevelt International Middle School, and St. Patrick's School.
Ownership History
Date
Name
Owned For
Owner Type
Purchase Details
Closed on
Jun 4, 2010
Sold by
Harvey Matthew David and Harvey Whitney Anne
Bought by
Carabez Dianna
Current Estimated Value
Home Financials for this Owner
Home Financials are based on the most recent Mortgage that was taken out on this home.
Original Mortgage
$132,000
Outstanding Balance
$88,206
Interest Rate
4.91%
Mortgage Type
New Conventional
Estimated Equity
$418,152
Purchase Details
Closed on
Aug 22, 2006
Sold by
Sd Investment Group Llc
Bought by
Harvey Matther David and Mc Lawhorn Whitney Anne
Home Financials for this Owner
Home Financials are based on the most recent Mortgage that was taken out on this home.
Original Mortgage
$56,200
Interest Rate
6.56%
Mortgage Type
Credit Line Revolving
Create a Home Valuation Report for This Property
The Home Valuation Report is an in-depth analysis detailing your home's value as well as a comparison with similar homes in the area
Home Values in the Area
Average Home Value in this Area
Purchase History
| Date | Buyer | Sale Price | Title Company |
|---|---|---|---|
| Carabez Dianna | $165,000 | Chicago Title Company | |
| Harvey Matther David | $281,000 | Fidelity National Title |
Source: Public Records
Mortgage History
| Date | Status | Borrower | Loan Amount |
|---|---|---|---|
| Open | Carabez Dianna | $132,000 | |
| Previous Owner | Harvey Matther David | $56,200 | |
| Previous Owner | Harvey Matther David | $224,800 |
Source: Public Records
Tax History Compared to Growth
Tax History
| Year | Tax Paid | Tax Assessment Tax Assessment Total Assessment is a certain percentage of the fair market value that is determined by local assessors to be the total taxable value of land and additions on the property. | Land | Improvement |
|---|---|---|---|---|
| 2025 | $2,852 | $232,333 | $148,437 | $83,896 |
| 2024 | $2,852 | $227,778 | $145,527 | $82,251 |
| 2023 | $2,788 | $223,313 | $142,674 | $80,639 |
| 2022 | $2,713 | $218,935 | $139,877 | $79,058 |
| 2021 | $2,694 | $214,643 | $137,135 | $77,508 |
| 2020 | $2,661 | $212,443 | $135,729 | $76,714 |
| 2019 | $2,614 | $208,278 | $133,068 | $75,210 |
| 2018 | $2,446 | $204,195 | $130,459 | $73,736 |
| 2017 | $80 | $200,192 | $127,901 | $72,291 |
| 2016 | $2,349 | $196,268 | $125,394 | $70,874 |
| 2015 | $2,315 | $193,321 | $123,511 | $69,810 |
| 2014 | $2,279 | $189,535 | $121,092 | $68,443 |
Source: Public Records
Map
Nearby Homes
- 3345 29th St
- 3345 29th St Unit 8
- 3345 29th St Unit 6
- 3345 29th St Unit 5
- 3345 29th St Unit 3
- 3345 29th St Unit 2
- 3345 29th St Unit 1
- 3333 29th St
- 3351 29th St
- 3327 29th St
- 3361 29th St
- 3386 29th St
- 3344 Dale St
- 3336 Dale St
- 3365 29th St
- 3321 29th St
- 3354 Dale St
- 3369 29th St
- 3330 Dale St
- 3358 Dale St