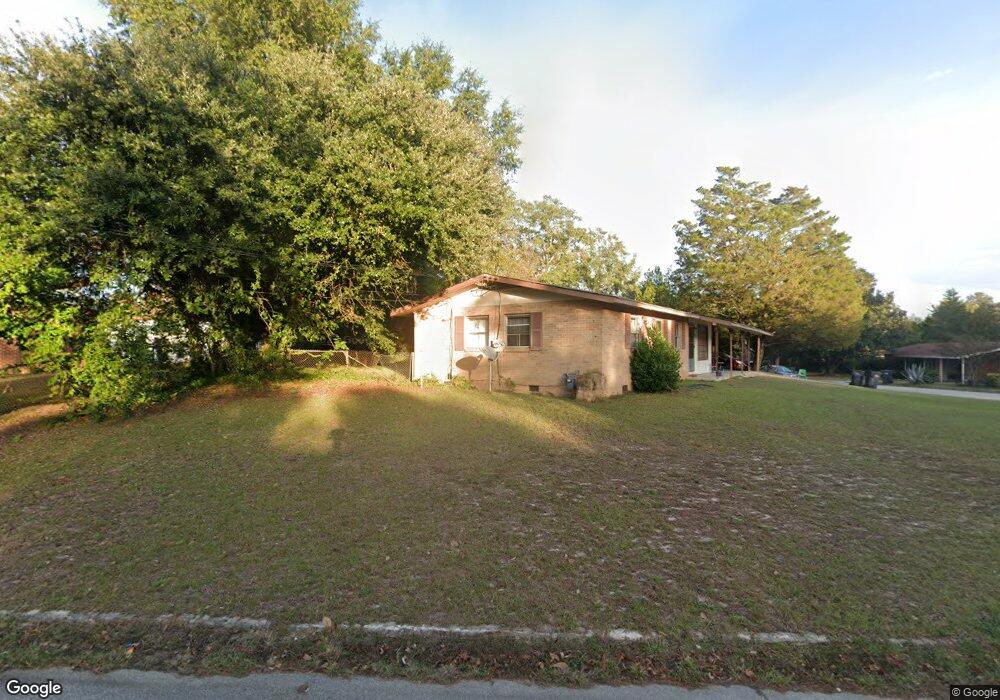
3345 Bardot Dr Augusta, GA 30909
Lake Aumond NeighborhoodEstimated Value: $171,000 - $192,000
3
Beds
2
Baths
1,450
Sq Ft
$124/Sq Ft
Est. Value
About This Home
This home is located at 3345 Bardot Dr, Augusta, GA 30909 and is currently estimated at $180,515, approximately $124 per square foot. 3345 Bardot Dr is a home located in Richmond County with nearby schools including Copeland Elementary School, Johnson Magnet, and Academy of Richmond County High School.
Ownership History
Date
Name
Owned For
Owner Type
Purchase Details
Closed on
Jun 21, 2001
Sold by
Va
Bought by
Khalifa Abdullah
Current Estimated Value
Home Financials for this Owner
Home Financials are based on the most recent Mortgage that was taken out on this home.
Original Mortgage
$48,600
Outstanding Balance
$17,750
Interest Rate
7.06%
Mortgage Type
Seller Take Back
Estimated Equity
$162,765
Purchase Details
Closed on
Nov 7, 2000
Sold by
Colonial Bank
Bought by
Va
Purchase Details
Closed on
Nov 30, 1995
Sold by
Boone Robert M
Bought by
Stovall Claudia L
Purchase Details
Closed on
Jan 31, 1991
Sold by
Boone Henrietta S
Bought by
Boone Robert M
Purchase Details
Closed on
Jan 1, 1989
Sold by
Wyer Timothy Thomas
Bought by
Boone Robert M
Purchase Details
Closed on
Dec 1, 1986
Sold by
Warlick Helen W
Bought by
Wyer Timothy Thomas
Purchase Details
Closed on
Mar 24, 1977
Sold by
Chandler Willis L
Bought by
Reilly John J
Create a Home Valuation Report for This Property
The Home Valuation Report is an in-depth analysis detailing your home's value as well as a comparison with similar homes in the area
Home Values in the Area
Average Home Value in this Area
Purchase History
We collect this data history from publicly available records. To have your information removed, we recommend requesting removal directly through your county’s website.
| Date | Buyer | Sale Price | Title Company |
|---|---|---|---|
| Khalifa Abdullah | $48,600 | -- | |
| Va | -- | -- | |
| Colonial Bank | $46,269 | -- | |
| Admin Of Veterans Affairs | $46,300 | -- | |
| Stovall Claudia L | $53,100 | -- | |
| Boone Robert M | -- | -- | |
| Boone Robert M | $53,100 | -- | |
| Wyer Timothy Thomas | $52,900 | -- | |
| Reilly John J | $23,800 | -- |
Source: Public Records
Mortgage History
We collect this data history from publicly available records. To have your information removed, we recommend requesting removal directly through your county’s website.
| Date | Status | Borrower | Loan Amount |
|---|---|---|---|
| Open | Khalifa Abdullah | $48,600 |
Source: Public Records
Tax History
| Year | Tax Paid | Tax Assessment Tax Assessment Total Assessment is a certain percentage of the fair market value that is determined by local assessors to be the total taxable value of land and additions on the property. | Land | Improvement |
|---|---|---|---|---|
| 2025 | $2,416 | $72,412 | $9,200 | $63,212 |
| 2024 | $2,416 | $68,368 | $9,200 | $59,168 |
| 2023 | $2,232 | $66,448 | $9,200 | $57,248 |
| 2022 | $1,603 | $43,110 | $9,200 | $33,910 |
| 2021 | $1,644 | $40,608 | $9,200 | $31,408 |
| 2020 | $1,620 | $40,608 | $9,200 | $31,408 |
| 2019 | $1,580 | $36,608 | $5,200 | $31,408 |
| 2018 | $1,590 | $36,608 | $5,200 | $31,408 |
| 2017 | $1,543 | $36,608 | $5,200 | $31,408 |
| 2016 | $1,544 | $36,608 | $5,200 | $31,408 |
| 2015 | $1,790 | $36,608 | $5,200 | $31,408 |
| 2014 | $1,555 | $36,608 | $5,200 | $31,408 |
Source: Public Records
Map
Nearby Homes
- 3340 Bardot Dr
- 1439 Ridgewood Dr
- 1421 Springview Dr
- 3346 Tanglewood Dr
- 3221 Alpine Rd
- 1408 Jackson Rd
- 3314 Idlewild Dr
- 1368 Marks Church Rd
- 3236 W Wimbledon Dr
- 3317 Forest Estates Dr
- 3379 Wedgewood Dr
- 3217 W Wimbledon Dr
- 3208 Wrightsboro Rd
- 1404 Springfield Ct
- 3207 W Wimbledon Dr
- 855 Wimbledon Dr
- 436 Forest Hills Dr
- 3509 Nassau Dr
- 856 Wimbledon Dr
- 3515 Jamaica Dr
- 3343 Bardot Dr
- 1418 Ridgewood Dr
- 1422 Ridgewood Dr
- 3341 Bardot Dr
- 1435 Ridgewood Dr
- 1433 Ridgewood Dr
- 1416 Ridgewood Dr
- 1437 Ridgewood Dr
- 1431 Ridgewood Dr
- 3339 Bardot Dr
- 1429 Ridgewood Dr
- 1424 Ridgewood Dr
- 1403 Ranch Dr
- 1414 Ridgewood Dr
- 1425 Ridgewood Dr
- 1427 Ridgewood Dr
- 1400 Ranch Dr
- 1423 Ridgewood Dr
- 1441 Ridgewood Dr
- 1426 Ridgewood Dr
Your Personal Tour Guide
Ask me questions while you tour the home.