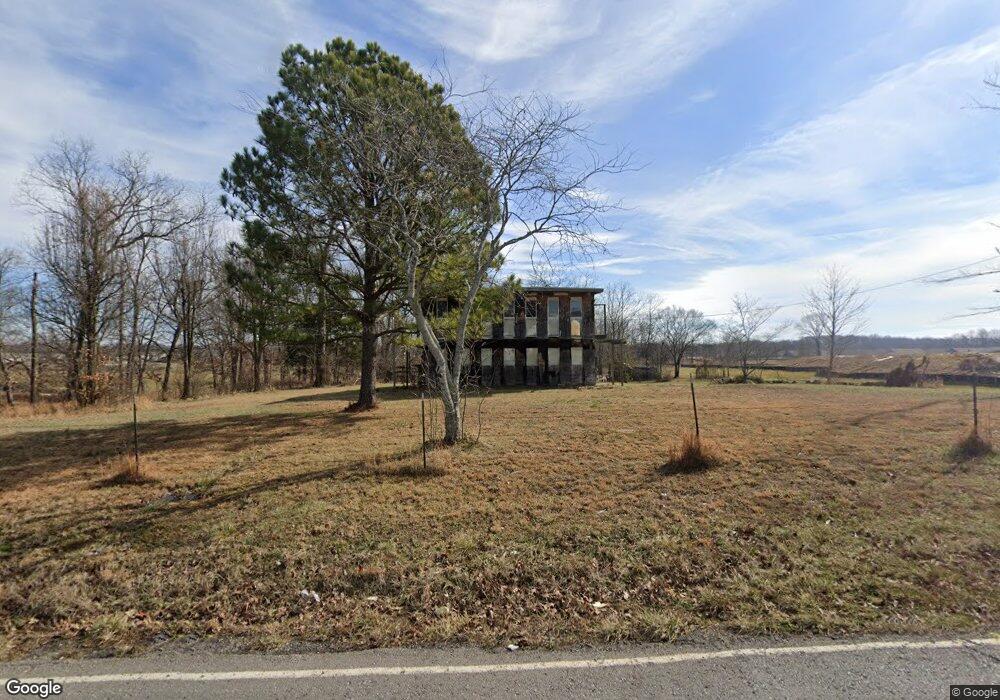
3345 Calista Rd White House, TN 37188
Estimated Value: $233,000 - $282,000
2
Beds
1
Bath
1,798
Sq Ft
$144/Sq Ft
Est. Value
About This Home
This home is located at 3345 Calista Rd, White House, TN 37188 and is currently estimated at $258,739, approximately $143 per square foot. 3345 Calista Rd is a home located in Robertson County with nearby schools including Robert F. Woodall Elementary School, White House Heritage Elementary School, and White House Heritage High School.
Ownership History
Date
Name
Owned For
Owner Type
Purchase Details
Closed on
May 1, 2025
Sold by
Gregory Deborah A
Bought by
Stagecoach Development
Current Estimated Value
Purchase Details
Closed on
May 30, 2006
Sold by
Rooks Harry R
Bought by
Deborah Gregory
Purchase Details
Closed on
Apr 28, 2006
Sold by
Beverly Hill
Bought by
Rooks Harry R
Purchase Details
Closed on
Jun 29, 2004
Sold by
Dana Stevens
Bought by
Baker Ann J and Baker Jimmy D
Purchase Details
Closed on
Jan 30, 1998
Sold by
Etal Stevens Lee
Bought by
Troy Stevens
Purchase Details
Closed on
Jan 3, 1995
Sold by
Sec Of Hud
Bought by
Etal Stevens Lee
Purchase Details
Closed on
Nov 4, 1992
Bought by
Hill Beverly
Purchase Details
Closed on
Mar 22, 1985
Bought by
Rooks Harry R and Hill Beverly
Purchase Details
Closed on
Feb 24, 1984
Purchase Details
Closed on
Jan 1, 1978
Create a Home Valuation Report for This Property
The Home Valuation Report is an in-depth analysis detailing your home's value as well as a comparison with similar homes in the area
Home Values in the Area
Average Home Value in this Area
Purchase History
| Date | Buyer | Sale Price | Title Company |
|---|---|---|---|
| Stagecoach Development | $225,000 | None Listed On Document | |
| Stagecoach Development | $225,000 | None Listed On Document | |
| Deborah Gregory | -- | -- | |
| Rooks Harry R | -- | -- | |
| Baker Ann J | $68,000 | -- | |
| Troy Stevens | -- | -- | |
| Etal Stevens Lee | $33,755 | -- | |
| Hill Beverly | -- | -- | |
| Rooks Harry R | -- | -- | |
| -- | -- | -- | |
| -- | $24,000 | -- |
Source: Public Records
Tax History Compared to Growth
Tax History
| Year | Tax Paid | Tax Assessment Tax Assessment Total Assessment is a certain percentage of the fair market value that is determined by local assessors to be the total taxable value of land and additions on the property. | Land | Improvement |
|---|---|---|---|---|
| 2025 | $700 | $38,875 | $0 | $0 |
| 2024 | $700 | $38,875 | $26,250 | $12,625 |
| 2023 | $700 | $38,875 | $26,250 | $12,625 |
| 2022 | $554 | $21,525 | $12,575 | $8,950 |
| 2021 | $554 | $21,525 | $12,575 | $8,950 |
| 2020 | $554 | $21,525 | $12,575 | $8,950 |
| 2019 | $554 | $21,525 | $12,575 | $8,950 |
| 2018 | $554 | $21,525 | $12,575 | $8,950 |
| 2017 | $521 | $16,900 | $10,075 | $6,825 |
| 2016 | $521 | $16,900 | $10,075 | $6,825 |
| 2015 | $500 | $16,900 | $10,075 | $6,825 |
| 2014 | $500 | $16,900 | $10,075 | $6,825 |
Source: Public Records
Map
Nearby Homes
- The Willow C Plan at Calista Farms
- The Franklin C Plan at Calista Farms
- The Ridgeport Plan at Calista Farms
- The Ash A Plan at Calista Farms
- The Logan A Plan at Calista Farms
- The Henry B Plan at Calista Farms
- The Asheville C Plan at Calista Farms
- The Franklin D Plan at Calista Farms
- The Henry A Plan at Calista Farms
- The Gordon A Plan at Calista Farms
- 4052 Burton Dr
- 4028 Burton Dr
- 1556 Netterfield Dr
- 2846 Ventura Ave
- 2269 Ventura Ave
- 1765 Ventura Ave
- 2584 Ventura Ave
- 2344 Ventura Ave
- 9022 Hutson Dr
- 4016 Burton Dr
- 3348 Calista Rd
- 3340 Calista Rd Unit 38787372
- 3340 Calista Rd Unit 38224339
- 3340 Calista Rd Unit 37963655
- 3340 Calista Rd Unit 37232414
- 3340 Calista Rd Unit 36486708
- 3340 Calista Rd
- 3342 Calista Rd
- 3357 Calista Rd
- 2102 Meredith Dr
- 2122 Meredith Dr
- 1556 Burton Dr
- 1556 Anderson Dr
- 1556 Tisdale Dr
- 3356 Calista Rd
- 819 Calista Rd
- 817 Calista Rd
- 1428 Burton Dr
- 1428 Anderson Dr
- 3362 Calista Rd