Estimated Value: $330,000 - $355,015
3
Beds
2
Baths
1,248
Sq Ft
$276/Sq Ft
Est. Value
About This Home
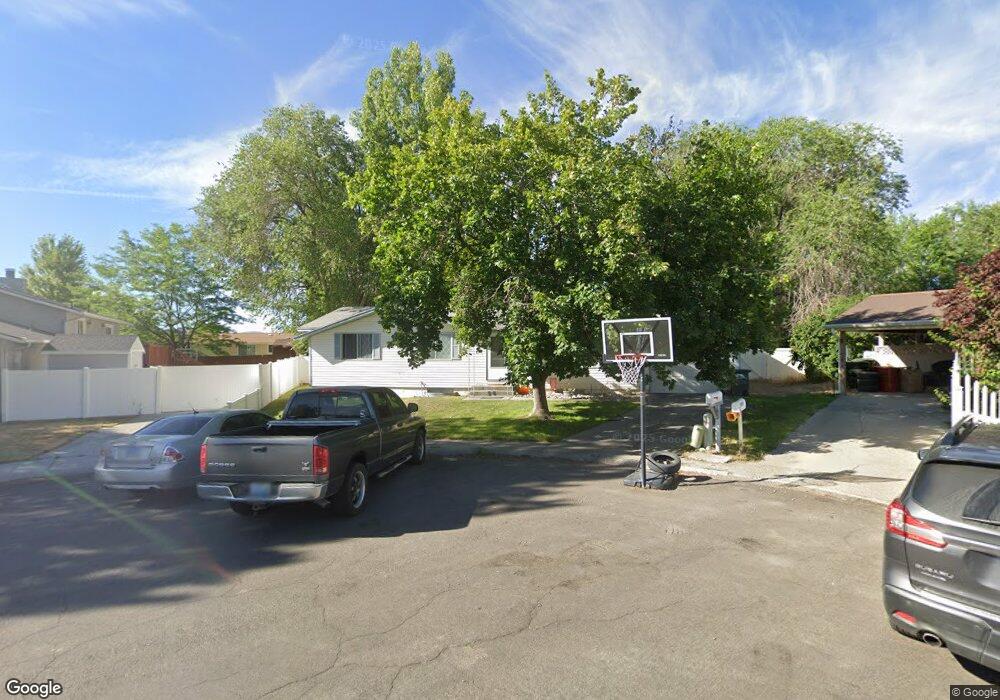
This home is located at 3345 Enfield Cir, Elko, NV 89801 and is currently estimated at $344,254, approximately $275 per square foot. 3345 Enfield Cir is a home located in Elko County with nearby schools including Mountain View Elementary School, Adobe Middle School, and Flagview Intermediate School.
Ownership History
Date
Name
Owned For
Owner Type
Purchase Details
Closed on
Nov 20, 2009
Sold by
Morrell Lucretianne
Bought by
Morrell Joshua K
Current Estimated Value
Home Financials for this Owner
Home Financials are based on the most recent Mortgage that was taken out on this home.
Original Mortgage
$227,310
Outstanding Balance
$147,511
Interest Rate
4.88%
Mortgage Type
FHA
Estimated Equity
$196,743
Purchase Details
Closed on
Apr 20, 2006
Sold by
Eudey Richard G and Eudey Florenda J
Bought by
Morrell Joshua K and Morrell Lucretianne
Home Financials for this Owner
Home Financials are based on the most recent Mortgage that was taken out on this home.
Original Mortgage
$180,000
Interest Rate
6.35%
Mortgage Type
Purchase Money Mortgage
Create a Home Valuation Report for This Property
The Home Valuation Report is an in-depth analysis detailing your home's value as well as a comparison with similar homes in the area
Home Values in the Area
Average Home Value in this Area
Purchase History
| Date | Buyer | Sale Price | Title Company |
|---|---|---|---|
| Morrell Joshua K | -- | Stewart Title Elko | |
| Morrell Joshua K | $225,000 | Stewart Title |
Source: Public Records
Mortgage History
| Date | Status | Borrower | Loan Amount |
|---|---|---|---|
| Open | Morrell Joshua K | $227,310 | |
| Closed | Morrell Joshua K | $180,000 |
Source: Public Records
Tax History Compared to Growth
Tax History
| Year | Tax Paid | Tax Assessment Tax Assessment Total Assessment is a certain percentage of the fair market value that is determined by local assessors to be the total taxable value of land and additions on the property. | Land | Improvement |
|---|---|---|---|---|
| 2025 | $2,116 | $56,352 | $14,875 | $41,477 |
| 2024 | $2,116 | $57,771 | $14,875 | $42,896 |
| 2023 | $1,962 | $55,497 | $14,875 | $40,622 |
| 2022 | $1,817 | $50,089 | $14,875 | $35,214 |
| 2021 | $1,682 | $49,488 | $14,875 | $34,613 |
| 2020 | $1,599 | $45,891 | $10,500 | $35,391 |
| 2019 | $1,557 | $44,687 | $10,500 | $34,187 |
| 2018 | $1,575 | $45,203 | $10,500 | $34,703 |
| 2017 | $1,572 | $45,113 | $10,500 | $34,613 |
| 2016 | $1,599 | $45,722 | $10,500 | $35,222 |
| 2015 | $1,592 | $43,736 | $10,500 | $33,236 |
| 2014 | $1,524 | $42,550 | $10,500 | $32,050 |
Source: Public Records
Map
Nearby Homes
- 3313 Carlson St
- 3346 Carlson Ave
- 2041 Eagle Ridge Loop Unit 11
- 151 Copper St
- 2045 Eagle Ridge Loop Unit 12
- 2034 Eagle Ridge Loop
- 2057 Eagle Ridge Loop
- 2990 Aria Way
- 658 Cortney Dr
- 2911 Aria Way
- 2918 Aria Way
- 2914 Aria Way
- 2043 Sierra Dr
- 2912 Aria Way
- 2970 Aria Way
- 2910 Aria Way
- 2905 Aria Way
- 2966 Aria Way
- 2971 Aria Way
- 2963 Aria Way
- 3355 Enfield Cir
- 558 Antimony St
- 572 Antimony St
- 3326 Freeport Ave
- 3348 Freeport Ave
- 526 Antimony St
- 3371 Enfield Cir
- 594 Antimony St
- 3365 Enfield Cir
- 3356 Freeport Ave
- 3366 Freeport Ave
- 3348 Enfield Ave
- 3336 Enfield Ave
- 563 Antimony St
- 547 Antimony St
- 3364 Enfield Ave
- 577 Antimony St
- 3375 Enfield Ave
- 3295 Enfield Ave
- 3327 Freeport Ave