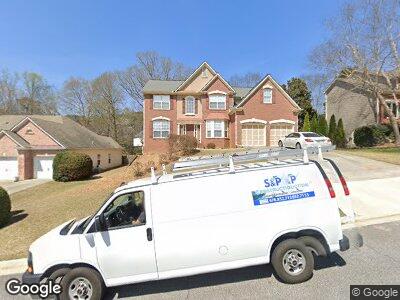
3345 Mainstay Place Alpharetta, GA 30022
Estimated Value: $617,000 - $747,000
3
Beds
3
Baths
2,784
Sq Ft
$245/Sq Ft
Est. Value
About This Home
This home is located at 3345 Mainstay Place, Alpharetta, GA 30022 and is currently estimated at $682,421, approximately $245 per square foot. 3345 Mainstay Place is a home located in Fulton County with nearby schools including Dolvin Elementary School, Autrey Mill Middle School, and Johns Creek High School.
Ownership History
Date
Name
Owned For
Owner Type
Purchase Details
Closed on
Jun 21, 2021
Sold by
Lee Jung Bum
Bought by
Lee Jung Bum and Lee Eun Kyoung
Current Estimated Value
Home Financials for this Owner
Home Financials are based on the most recent Mortgage that was taken out on this home.
Original Mortgage
$398,700
Outstanding Balance
$365,656
Interest Rate
2.9%
Mortgage Type
New Conventional
Estimated Equity
$316,765
Purchase Details
Closed on
Apr 10, 2014
Sold by
Stearns Bank Na
Bought by
Lim Hye Jung
Home Financials for this Owner
Home Financials are based on the most recent Mortgage that was taken out on this home.
Original Mortgage
$220,800
Interest Rate
4.43%
Mortgage Type
New Conventional
Purchase Details
Closed on
Feb 4, 2014
Sold by
Carrara Garrett
Bought by
Stearns Bank Na
Create a Home Valuation Report for This Property
The Home Valuation Report is an in-depth analysis detailing your home's value as well as a comparison with similar homes in the area
Home Values in the Area
Average Home Value in this Area
Purchase History
| Date | Buyer | Sale Price | Title Company |
|---|---|---|---|
| Lee Jung Bum | -- | -- | |
| Lee Jung Bum | $443,000 | -- | |
| Lim Hye Jung | $276,000 | -- | |
| Stearns Bank Na | $275,000 | -- |
Source: Public Records
Mortgage History
| Date | Status | Borrower | Loan Amount |
|---|---|---|---|
| Open | Lee Jung Bum | $398,700 | |
| Closed | Lee Jung Bum | $398,700 | |
| Previous Owner | Lim Hye Jung | $220,800 | |
| Previous Owner | Carrara Garrett | $363,500 | |
| Previous Owner | Carrara Carrett | $68,600 | |
| Previous Owner | Carrara Garrett W | $50,750 | |
| Previous Owner | Carrara Garrett | $267,500 | |
| Previous Owner | Carrara Garrett W | $217,900 |
Source: Public Records
Tax History Compared to Growth
Tax History
| Year | Tax Paid | Tax Assessment Tax Assessment Total Assessment is a certain percentage of the fair market value that is determined by local assessors to be the total taxable value of land and additions on the property. | Land | Improvement |
|---|---|---|---|---|
| 2023 | $7,274 | $257,720 | $91,440 | $166,280 |
| 2022 | $4,362 | $177,200 | $48,400 | $128,800 |
| 2021 | $3,816 | $223,880 | $58,000 | $165,880 |
| 2020 | $3,815 | $191,880 | $49,560 | $142,320 |
| 2019 | $521 | $171,440 | $51,680 | $119,760 |
| 2018 | $4,183 | $167,440 | $50,480 | $116,960 |
| 2017 | $2,872 | $110,376 | $33,296 | $77,080 |
| 2016 | $2,871 | $110,380 | $33,300 | $77,080 |
| 2015 | $3,317 | $110,380 | $33,300 | $77,080 |
| 2014 | $3,908 | $142,680 | $43,560 | $99,120 |
Source: Public Records
Map
Nearby Homes
- 370 Fairleaf Ct Unit 1
- 3295 Waters Mill Dr
- 850 Highland Bend Cove
- 10420 Summer Creek Dr
- 10540 Waters Ridge Dr
- 1430 Hampton Hill Dr
- 2590 Runic Way
- 10490 Cranchester Way
- 3480 Stillridge Dr
- 10350 Alvin Rd
- 10440 Cranchester Way Unit 2
- 10660 Dunoon Dr Unit 1
- 10835 Tuxford Dr
- 3680 Milton Park Dr
- 3585 Legacy Trace
- 120 Thome Dr
- 870 Thornberry Dr Unit 2
- 3277 Bluejay Ln Unit 41
- 3345 Mainstay Place
- 3335 Mainstay Place
- 3355 Mainstay Place
- 430 Sailmaker Cir
- 440 Sailmaker Cir
- 3365 Mainstay Place
- 3325 Mainstay Place Unit 25
- 3325 Mainstay Place
- 420 Sailmaker Cir
- 3350 Mainstay Place
- 3340 Mainstay Place
- 0 Mainstay Place Unit 7474962
- 0 Mainstay Place Unit 8450068
- 0 Mainstay Place Unit 8262524
- 0 Mainstay Place Unit 9045608
- 0 Mainstay Place Unit 7171191
- 0 Mainstay Place Unit 25 7195899
- 0 Mainstay Place Unit 7218294
- 0 Mainstay Place Unit 7239839
- 0 Mainstay Place Unit 7250923