3345 Nevada Ave N Unit 4501 Minneapolis, MN 55427
Valley Place NeighborhoodEstimated Value: $155,148 - $159,000
2
Beds
1
Bath
872
Sq Ft
$180/Sq Ft
Est. Value
About This Home
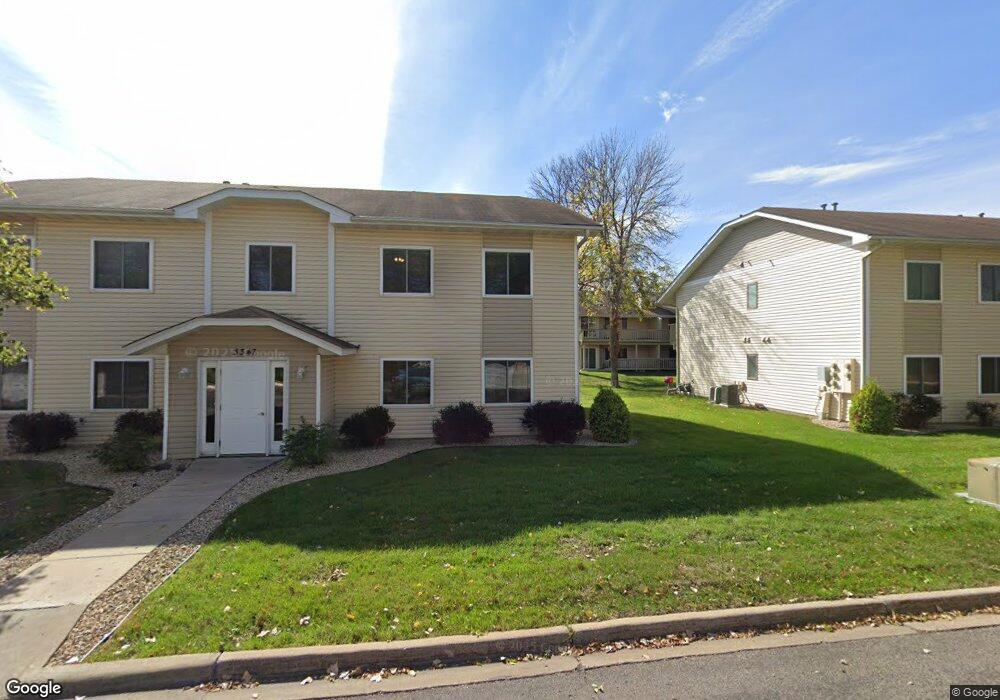
This home is located at 3345 Nevada Ave N Unit 4501, Minneapolis, MN 55427 and is currently estimated at $157,287, approximately $180 per square foot. 3345 Nevada Ave N Unit 4501 is a home located in Hennepin County with nearby schools including Neill Elementary School, Plymouth Middle School, and Armstrong High School.
Ownership History
Date
Name
Owned For
Owner Type
Purchase Details
Closed on
Mar 1, 2023
Sold by
Weinblatt Mr Michael
Bought by
Tutewohl Ms Shaina
Current Estimated Value
Purchase Details
Closed on
Oct 28, 2011
Sold by
Federal National Mortgage Association
Bought by
Weinblatt Michael and Tutewohl Shaina
Purchase Details
Closed on
Oct 6, 2011
Sold by
Bank Of America Na
Bought by
Federal National Mortgage Corporation
Purchase Details
Closed on
Jun 10, 2011
Sold by
Zufall Becky S
Bought by
Bac Home Loans Servicing Lp
Purchase Details
Closed on
Sep 29, 2006
Sold by
Wilberding Helen M and Wilberding Timothy R
Bought by
Zufall Becky S
Purchase Details
Closed on
Jul 30, 1999
Sold by
Olson Suzanne M
Bought by
Durgin Helen M
Purchase Details
Closed on
Jun 25, 1998
Sold by
Haase Lorraine E
Bought by
Olson Suzanne M
Create a Home Valuation Report for This Property
The Home Valuation Report is an in-depth analysis detailing your home's value as well as a comparison with similar homes in the area
Home Values in the Area
Average Home Value in this Area
Purchase History
| Date | Buyer | Sale Price | Title Company |
|---|---|---|---|
| Tutewohl Ms Shaina | -- | None Listed On Document | |
| Weinblatt Michael | -- | Signature Title Midwest Serv | |
| Federal National Mortgage Corporation | -- | None Available | |
| Bac Home Loans Servicing Lp | $99,982 | -- | |
| Zufall Becky S | $121,000 | -- | |
| Durgin Helen M | $79,900 | -- | |
| Olson Suzanne M | $68,350 | -- |
Source: Public Records
Tax History Compared to Growth
Tax History
| Year | Tax Paid | Tax Assessment Tax Assessment Total Assessment is a certain percentage of the fair market value that is determined by local assessors to be the total taxable value of land and additions on the property. | Land | Improvement |
|---|---|---|---|---|
| 2024 | $2,003 | $146,800 | $17,000 | $129,800 |
| 2023 | $1,926 | $149,600 | $17,000 | $132,600 |
| 2022 | $1,864 | $143,000 | $18,000 | $125,000 |
| 2021 | $1,757 | $141,000 | $22,000 | $119,000 |
| 2020 | $1,613 | $131,000 | $16,000 | $115,000 |
| 2019 | $1,464 | $119,000 | $10,000 | $109,000 |
| 2018 | $1,081 | $105,000 | $10,000 | $95,000 |
| 2017 | $731 | $54,000 | $10,000 | $44,000 |
| 2016 | $720 | $50,000 | $10,000 | $40,000 |
| 2015 | $598 | $42,000 | $10,000 | $32,000 |
| 2014 | -- | $44,000 | $10,000 | $34,000 |
Source: Public Records
Map
Nearby Homes
- 3337 Nevada Ave N Unit 3702
- 6701 34th Ave N
- 3010 Kentucky Ave N
- 3108 Virginia Ave N
- 3409 Wisconsin Ave N
- 8214 32nd Place N
- 6602 36th Ave N
- 3420 Xylon Ave N
- 3551 Wisconsin Ave N
- 2901 Valle Vista St
- 3811 Idaho Ave N
- 2900 Sumter Ave N
- 3407 Douglas Dr N
- 3413 Douglas Dr N
- 3912 Jersey Ave N
- 3517 Douglas Dr N
- 3933 Oregon Ave N
- 8417 32nd Ave N
- 3951 Oregon Ave N
- 2827 Hampshire Ave N
- 3345 Nevada Ave N Unit 4504
- 3345 Nevada Ave N Unit 4503
- 3345 Nevada Ave N Unit 4502
- 3345 Nevada Ave N
- 3345 Nevada Ave N Unit 1
- 3345 Nevada Ave N Unit 3
- 3347 Nevada Ave N Unit 4704
- 3347 Nevada Ave N Unit 4703
- 3347 Nevada Ave N Unit 4702
- 3347 Nevada Ave N Unit 4701
- 3347 Nevada Ave N
- 3347 Nevada Ave N Unit 4704
- 3347 Nevada Ave N Unit 2
- 3347 Nevada Ave N
- 3343 Nevada Ave N Unit 4304
- 3343 Nevada Ave N Unit 4303
- 3343 Nevada Ave N Unit 4302
- 3343 Nevada Ave N Unit 4301
- 3343 Nevada Ave N
- 3339 Nevada Ave N Unit B208