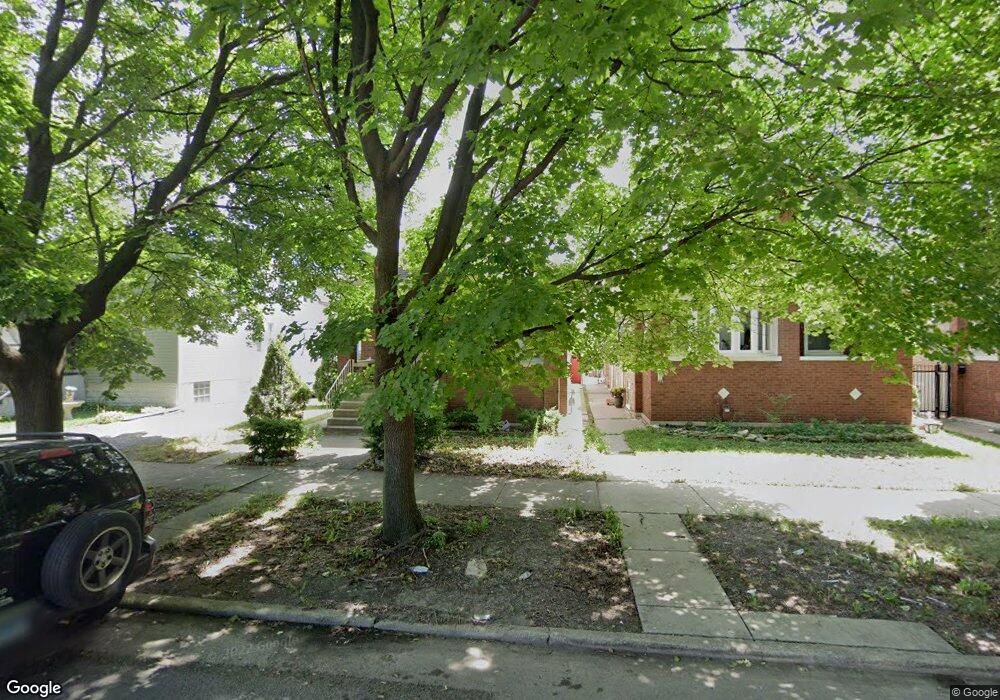
3345 W 66th St Chicago, IL 60629
Marquette Park NeighborhoodEstimated Value: $165,000 - $265,000
2
Beds
2
Baths
1,127
Sq Ft
$193/Sq Ft
Est. Value
About This Home
This home is located at 3345 W 66th St, Chicago, IL 60629 and is currently estimated at $217,536, approximately $193 per square foot. 3345 W 66th St is a home located in Cook County with nearby schools including Eberhart Elementary School, Hubbard High School, and Catalyst Maria Charter School.
Ownership History
Date
Name
Owned For
Owner Type
Purchase Details
Closed on
Mar 21, 2011
Sold by
Fannie Mae
Bought by
Trujillo Sarah
Current Estimated Value
Purchase Details
Closed on
Jan 14, 2011
Sold by
Cortez Francisco J
Bought by
Federal National Mortgage Association
Purchase Details
Closed on
Mar 31, 2006
Sold by
Cortez Francisco
Bought by
Cortez Francisco J
Home Financials for this Owner
Home Financials are based on the most recent Mortgage that was taken out on this home.
Original Mortgage
$150,000
Interest Rate
6.48%
Mortgage Type
Fannie Mae Freddie Mac
Purchase Details
Closed on
Jul 31, 2000
Sold by
Flores Sabas A
Bought by
Cortez Francisco
Home Financials for this Owner
Home Financials are based on the most recent Mortgage that was taken out on this home.
Original Mortgage
$97,850
Interest Rate
8.19%
Purchase Details
Closed on
Oct 28, 1993
Sold by
Johnson Patrick and Johnson Jackie
Bought by
Flores Sabas and Flores Rogelio
Create a Home Valuation Report for This Property
The Home Valuation Report is an in-depth analysis detailing your home's value as well as a comparison with similar homes in the area
Home Values in the Area
Average Home Value in this Area
Purchase History
| Date | Buyer | Sale Price | Title Company |
|---|---|---|---|
| Trujillo Sarah | $65,000 | First American | |
| Federal National Mortgage Association | -- | None Available | |
| Cortez Francisco J | -- | Synergy Title Services Llc | |
| Cortez Francisco | $103,000 | Chicago Title Insurance Co | |
| Flores Sabas | $49,333 | -- |
Source: Public Records
Mortgage History
| Date | Status | Borrower | Loan Amount |
|---|---|---|---|
| Previous Owner | Cortez Francisco J | $150,000 | |
| Previous Owner | Cortez Francisco | $97,850 |
Source: Public Records
Tax History
| Year | Tax Paid | Tax Assessment Tax Assessment Total Assessment is a certain percentage of the fair market value that is determined by local assessors to be the total taxable value of land and additions on the property. | Land | Improvement |
|---|---|---|---|---|
| 2025 | $2,479 | $17,000 | $2,170 | $14,830 |
| 2024 | $2,479 | $17,000 | $2,170 | $14,830 |
| 2023 | $2,395 | $15,000 | $3,689 | $11,311 |
| 2022 | $2,395 | $15,000 | $3,689 | $11,311 |
| 2021 | $2,347 | $15,000 | $3,689 | $11,311 |
| 2020 | $2,098 | $12,459 | $3,689 | $8,770 |
| 2019 | $2,169 | $14,158 | $3,689 | $10,469 |
| 2018 | $2,132 | $14,158 | $3,689 | $10,469 |
| 2017 | $1,906 | $12,172 | $3,255 | $8,917 |
| 2016 | $1,951 | $12,172 | $3,255 | $8,917 |
| 2015 | $1,763 | $12,172 | $3,255 | $8,917 |
| 2014 | $1,649 | $11,385 | $3,038 | $8,347 |
| 2013 | $1,605 | $11,385 | $3,038 | $8,347 |
Source: Public Records
Map
Nearby Homes
- 3220 W 66th St
- 3416 W 64th Place
- 3424 W 64th Place
- 3331 W 64th St
- 3604 W 65th Place
- 3411 W 63rd Place
- 6409 S Albany Ave
- 6339 S Troy St
- 3709 W 66th Place
- 3651 W 64th Place
- 6319 S Troy St
- 3545 W 62nd Place
- 6333 S Whipple St
- 3750 W 65th St
- 3313 W 61st Place
- 3815 W Marquette Rd
- 3819 W 66th Place
- 3501 W 61st Place
- 6341 S Richmond St
- 6512 S Mozart St
- 3349 W 66th St
- 3341 W 66th St
- 3353 W 66th St
- 3355 W 66th St
- 3333 W 66th St
- 3357 W 66th St
- 3344 W 66th Place
- 3348 W 66th Place
- 3331 W 66th St
- 3340 W 66th Place
- 3352 W 66th Place
- 3352 W 66th Place
- 3336 W 66th Place
- 3334 W 66th Place
- 3329 W 66th St
- 3330 W 66th Place
- 3344 W 66th St
- 3340 W 66th St
- 3350 W 66th St
Your Personal Tour Guide
Ask me questions while you tour the home.