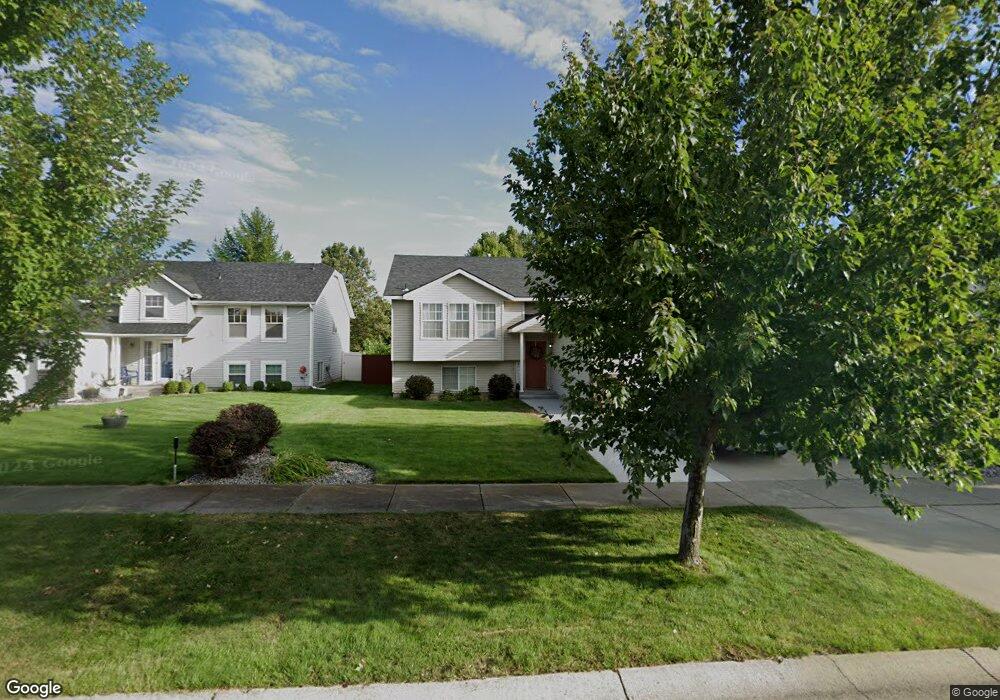
3346 N Alfalfa Loop Post Falls, ID 83854
North Prairie NeighborhoodEstimated Value: $472,000 - $595,000
6
Beds
3
Baths
2,670
Sq Ft
$201/Sq Ft
Est. Value
About This Home
This home is located at 3346 N Alfalfa Loop, Post Falls, ID 83854 and is currently estimated at $536,506, approximately $200 per square foot. 3346 N Alfalfa Loop is a home with nearby schools including Prairie View Elementary School, Post Falls Middle School, and Post Falls High School.
Ownership History
Date
Name
Owned For
Owner Type
Purchase Details
Closed on
Jun 5, 2019
Sold by
Jacobs Michael C and Jacobs Ann Marie
Bought by
Montee Robert D and Montee Dalry D
Current Estimated Value
Home Financials for this Owner
Home Financials are based on the most recent Mortgage that was taken out on this home.
Original Mortgage
$320,095
Outstanding Balance
$276,971
Interest Rate
3.75%
Mortgage Type
FHA
Estimated Equity
$259,535
Purchase Details
Closed on
May 22, 2009
Sold by
Moore Daniel L and Moore Karen A
Bought by
Gilmor Thomas J and Gilmor Annemarie
Home Financials for this Owner
Home Financials are based on the most recent Mortgage that was taken out on this home.
Original Mortgage
$179,000
Interest Rate
4.82%
Mortgage Type
Seller Take Back
Purchase Details
Closed on
Apr 20, 2005
Sold by
Holley John M and Holley Stacey L
Bought by
Jacobs Michael C and Jacobs Ann Marie
Home Financials for this Owner
Home Financials are based on the most recent Mortgage that was taken out on this home.
Original Mortgage
$172,000
Interest Rate
5.92%
Mortgage Type
Credit Line Revolving
Create a Home Valuation Report for This Property
The Home Valuation Report is an in-depth analysis detailing your home's value as well as a comparison with similar homes in the area
Home Values in the Area
Average Home Value in this Area
Purchase History
| Date | Buyer | Sale Price | Title Company |
|---|---|---|---|
| Montee Robert D | -- | Pioneer Title Kootenai Cnty | |
| Gilmor Thomas J | -- | -- | |
| Jacobs Michael C | -- | -- |
Source: Public Records
Mortgage History
| Date | Status | Borrower | Loan Amount |
|---|---|---|---|
| Open | Montee Robert D | $320,095 | |
| Previous Owner | Gilmor Thomas J | $179,000 | |
| Previous Owner | Jacobs Michael C | $172,000 |
Source: Public Records
Tax History
| Year | Tax Paid | Tax Assessment Tax Assessment Total Assessment is a certain percentage of the fair market value that is determined by local assessors to be the total taxable value of land and additions on the property. | Land | Improvement |
|---|---|---|---|---|
| 2025 | $1,942 | $485,710 | $175,000 | $310,710 |
| 2024 | $1,880 | $462,160 | $152,000 | $310,160 |
| 2023 | $1,880 | $494,972 | $160,000 | $334,972 |
| 2022 | $2,501 | $529,692 | $157,500 | $372,192 |
| 2021 | $2,138 | $334,390 | $105,000 | $229,390 |
| 2020 | $2,224 | $293,310 | $90,000 | $203,310 |
| 2019 | $3,497 | $278,910 | $90,000 | $188,910 |
| 2018 | $3,348 | $242,270 | $70,000 | $172,270 |
| 2017 | $3,289 | $218,150 | $50,000 | $168,150 |
| 2016 | $3,174 | $199,240 | $40,000 | $159,240 |
| 2015 | $1,803 | $196,450 | $37,000 | $159,450 |
| 2013 | $2,997 | $171,270 | $32,000 | $139,270 |
Source: Public Records
Map
Nearby Homes
- 2870 N Dandelion St
- 2815 N Sand Trap Way
- 908 E Allenby Ct
- 2325 N Mackenzie Dr
- 1042 E Allenby Ave
- 1074 E Allenby Ave
- 2533 N Side Saddle Ln
- 2815 N Top Flight Dr
- 2858 N Alfalfa Loop
- 2499 Side Saddle
- 2489 N Side Saddle Ln
- 2815 N Slice Dr
- 910 E Shasta Ave
- 1401 E Warm Springs Ave
- 3283 N Segar Loop
- 3321 N Segar Loop
- 3294 N Segar Loop
- 1106 E Walton Ct
- 3310 N Segar Loop
- 3328 N Segar Loop
- 3364 N Alfalfa Loop
- 3330 N Alfalfa Loop
- 3384 N Alfalfa Loop
- 3324 N Alfalfa Loop
- 3295 N Alfalfa Loop
- 2877 Ivy Ln
- 3402 N Alfalfa Loop
- 3316 N Alfalfa Loop
- 3312 N Alfalfa Loop
- 3275 N Alfalfa Loop
- 3422 N Alfalfa Loop
- 2869 N Ivy Ln
- 3294 N Alfalfa Loop
- 2845 N Ivy Ln
- 3259 N Alfalfa Loop
- 3274 N Alfalfa Loop
- 3440 N Alfalfa Loop
- 2827 N Ivy Ln
- 3258 N Alfalfa Loop
- 2864 N Ivy Ln
Your Personal Tour Guide
Ask me questions while you tour the home.