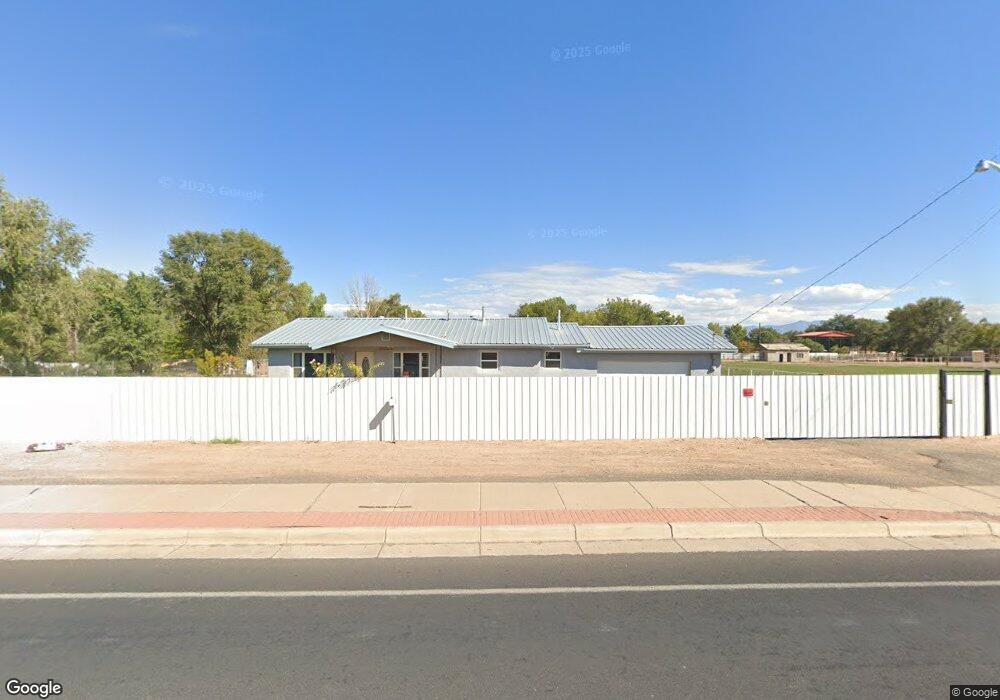
3347 State Highway 47 Los Lunas, NM 87031
East Los Lunas NeighborhoodEstimated Value: $224,000 - $346,000
3
Beds
2
Baths
1,558
Sq Ft
$192/Sq Ft
Est. Value
About This Home
This home is located at 3347 State Highway 47, Los Lunas, NM 87031 and is currently estimated at $298,499, approximately $191 per square foot. 3347 State Highway 47 is a home located in Valencia County with nearby schools including Valencia Elementary School, Valencia Middle School, and Valencia High School.
Ownership History
Date
Name
Owned For
Owner Type
Purchase Details
Closed on
May 3, 2019
Sold by
Maestas Stella
Bought by
Gurule Rosann P
Current Estimated Value
Home Financials for this Owner
Home Financials are based on the most recent Mortgage that was taken out on this home.
Original Mortgage
$128,250
Outstanding Balance
$113,431
Interest Rate
4.5%
Mortgage Type
Adjustable Rate Mortgage/ARM
Estimated Equity
$185,068
Purchase Details
Closed on
Apr 3, 2019
Sold by
Maestas Olivia and Maestas Benjamin E
Bought by
Maestas Stella
Home Financials for this Owner
Home Financials are based on the most recent Mortgage that was taken out on this home.
Original Mortgage
$128,250
Outstanding Balance
$113,431
Interest Rate
4.5%
Mortgage Type
Adjustable Rate Mortgage/ARM
Estimated Equity
$185,068
Purchase Details
Closed on
Jul 30, 2018
Sold by
Maestas Dorothy
Bought by
Below Soe
Create a Home Valuation Report for This Property
The Home Valuation Report is an in-depth analysis detailing your home's value as well as a comparison with similar homes in the area
Home Values in the Area
Average Home Value in this Area
Purchase History
| Date | Buyer | Sale Price | Title Company |
|---|---|---|---|
| Gurule Rosann P | -- | Fidelity National Ttl Ins Co | |
| Maestas Benjamin E | -- | Fidelity National Ttl Ins Co | |
| Maestas Stella | -- | Fidelity National Ttl Ins Co | |
| Below Soe | -- | None Available |
Source: Public Records
Mortgage History
| Date | Status | Borrower | Loan Amount |
|---|---|---|---|
| Open | Gurule Rosann P | $128,250 |
Source: Public Records
Tax History Compared to Growth
Tax History
| Year | Tax Paid | Tax Assessment Tax Assessment Total Assessment is a certain percentage of the fair market value that is determined by local assessors to be the total taxable value of land and additions on the property. | Land | Improvement |
|---|---|---|---|---|
| 2024 | $1,609 | $51,905 | $14,667 | $37,238 |
| 2023 | $1,580 | $50,393 | $14,667 | $35,726 |
| 2022 | $1,477 | $48,925 | $15,107 | $33,818 |
| 2021 | $1,463 | $48,210 | $16,098 | $32,112 |
| 2020 | $1,437 | $46,806 | $15,629 | $31,177 |
| 2019 | $1,175 | $38,395 | $15,362 | $23,033 |
| 2018 | $1,166 | $38,395 | $15,362 | $23,033 |
| 2017 | $1,098 | $38,395 | $15,362 | $23,033 |
| 2016 | $1,071 | $38,096 | $15,362 | $22,734 |
| 2015 | -- | $36,987 | $15,362 | $21,625 |
| 2013 | -- | $34,864 | $15,362 | $19,502 |
| 2011 | -- | $101,547 | $44,745 | $56,802 |
Source: Public Records
Map
Nearby Homes