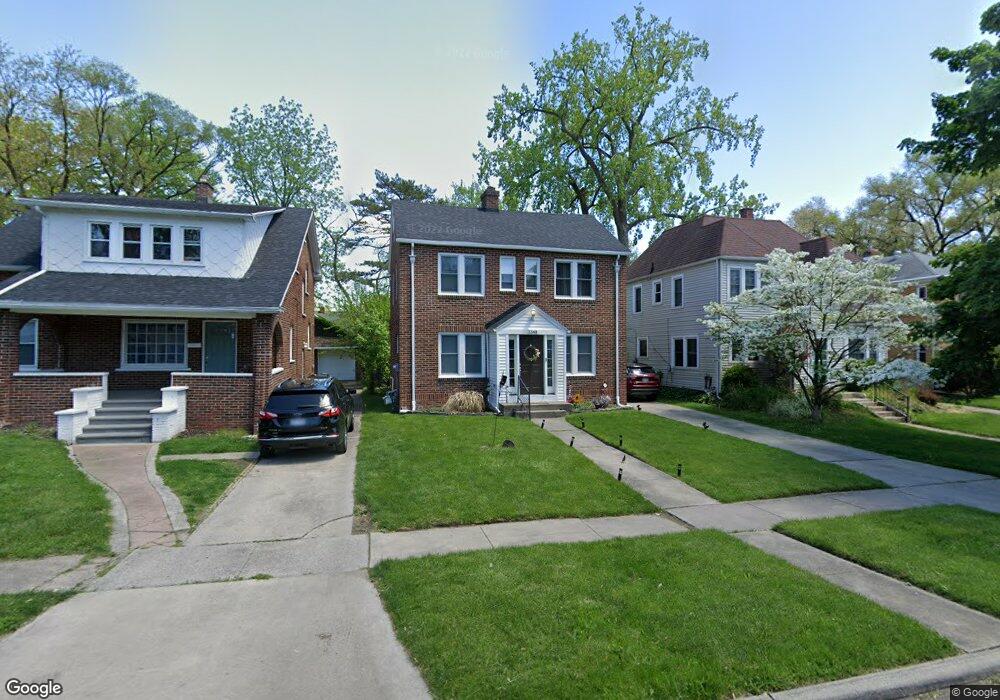
3348 Harley Rd Toledo, OH 43606
DeVeaux NeighborhoodEstimated Value: $141,000 - $186,000
3
Beds
1
Bath
1,320
Sq Ft
$122/Sq Ft
Est. Value
About This Home
This home is located at 3348 Harley Rd, Toledo, OH 43606 and is currently estimated at $160,858, approximately $121 per square foot. 3348 Harley Rd is a home located in Lucas County with nearby schools including DeVeaux Elementary School, Start High School, and Hope Learning Academy of Toledo.
Ownership History
Date
Name
Owned For
Owner Type
Purchase Details
Closed on
Feb 22, 2019
Sold by
Bird S Drywall Inc
Bought by
Pettaway Nia
Current Estimated Value
Home Financials for this Owner
Home Financials are based on the most recent Mortgage that was taken out on this home.
Original Mortgage
$122,735
Outstanding Balance
$109,981
Interest Rate
5.5%
Mortgage Type
FHA
Estimated Equity
$50,877
Purchase Details
Closed on
Mar 10, 2011
Sold by
Naghmouchi Ann Marie and Naghmouchi Anis Ben Mohamed
Bought by
Birds Drywall Inc
Purchase Details
Closed on
Jan 3, 2011
Sold by
Naghmouchi Ann Marie and Naghmouchi Anis Ben Mohamed
Bought by
Naghmouchi Ann Marie and Naghmouchi Anis Ben Mohamed
Purchase Details
Closed on
Aug 12, 2009
Sold by
Davis Barbara A
Bought by
Naghmouchi Ann Marie
Purchase Details
Closed on
Mar 28, 2005
Sold by
Davis Robert E
Bought by
Davis Barbara A
Create a Home Valuation Report for This Property
The Home Valuation Report is an in-depth analysis detailing your home's value as well as a comparison with similar homes in the area
Home Values in the Area
Average Home Value in this Area
Purchase History
| Date | Buyer | Sale Price | Title Company |
|---|---|---|---|
| Pettaway Nia | $125,000 | Liberty Title Inc | |
| Birds Drywall Inc | $24,400 | Attorney | |
| Naghmouchi Ann Marie | -- | None Available | |
| Naghmouchi Ann Marie | -- | Attorney | |
| Naghmouchi Ann Marie | -- | Attorney | |
| Davis Barbara A | -- | -- |
Source: Public Records
Mortgage History
| Date | Status | Borrower | Loan Amount |
|---|---|---|---|
| Open | Pettaway Nia | $122,735 |
Source: Public Records
Tax History Compared to Growth
Tax History
| Year | Tax Paid | Tax Assessment Tax Assessment Total Assessment is a certain percentage of the fair market value that is determined by local assessors to be the total taxable value of land and additions on the property. | Land | Improvement |
|---|---|---|---|---|
| 2024 | $1,057 | $34,755 | $5,810 | $28,945 |
| 2023 | $1,732 | $27,055 | $4,620 | $22,435 |
| 2022 | $1,735 | $27,055 | $4,620 | $22,435 |
| 2021 | $1,776 | $27,055 | $4,620 | $22,435 |
| 2020 | $1,684 | $22,575 | $3,885 | $18,690 |
| 2019 | $1,676 | $22,575 | $3,885 | $18,690 |
| 2018 | $1,629 | $22,575 | $3,885 | $18,690 |
| 2017 | $2,070 | $20,335 | $3,430 | $16,905 |
| 2016 | $2,343 | $58,100 | $9,800 | $48,300 |
| 2015 | $1,580 | $58,100 | $9,800 | $48,300 |
| 2014 | $1,972 | $20,340 | $3,430 | $16,910 |
| 2013 | $1,315 | $20,340 | $3,430 | $16,910 |
Source: Public Records
Map
Nearby Homes
- 3350 Wyckliffe Pkwy
- 3512 Wyckliffe Pkwy
- 3512 Rushland Ave
- 3037 Sherbrooke Rd
- 3540 Kershaw Ave
- 3251 Northwood Ave
- 3560 Bellevue Rd
- 3031 Douglas Rd
- 3233 Saint Bernard Dr
- 3538 Grantley Rd
- 3306 Saint Bernard Dr
- 3621 Sherbrooke Rd
- 2927 Sherbrooke Rd
- 3656 Bellevue Rd
- 2146 Marlow Rd
- 3646 Garrison Rd
- 2426 Berdan Ave
- 3433 Goddard Rd
- 2939 Midwood Ave
- 2433 Georgetown Ave
- 3352 Harley Rd
- 3340 Harley Rd
- 3356 Harley Rd
- 3345 Douglas Rd
- 3341 Douglas Rd
- 3349 Douglas Rd
- 3360 Harley Rd
- 3336 Harley Rd
- 3337 Douglas Rd
- 3353 Douglas Rd
- 3402 Harley Rd
- 3357 Douglas Rd
- 3347 Harley Rd
- 3343 Harley Rd
- 3351 Harley Rd
- 3334 Harley Rd
- 3337 Harley Rd
- 3355 Harley Rd
- 3401 Douglas Rd
- 3406 Harley Rd