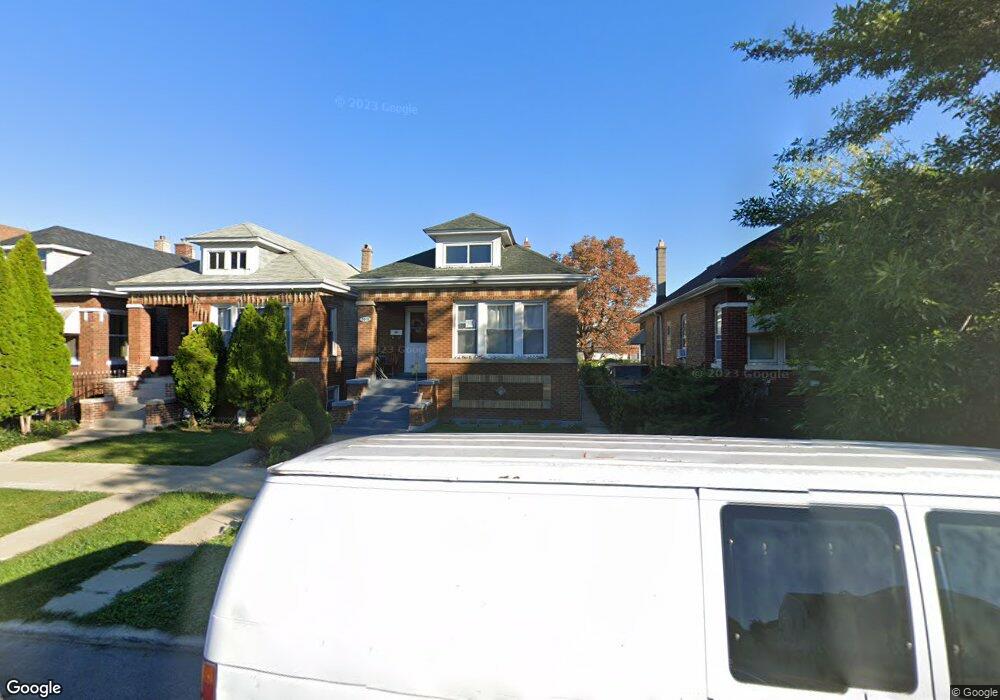
3348 W 60th Place Chicago, IL 60629
Chicago Lawn NeighborhoodEstimated Value: $262,776 - $308,000
2
Beds
1
Bath
952
Sq Ft
$300/Sq Ft
Est. Value
About This Home
This home is located at 3348 W 60th Place, Chicago, IL 60629 and is currently estimated at $285,944, approximately $300 per square foot. 3348 W 60th Place is a home located in Cook County with nearby schools including Monarcas Academy, Hernandez Middle School, and Hubbard High School.
Ownership History
Date
Name
Owned For
Owner Type
Purchase Details
Closed on
Sep 30, 2005
Sold by
Dempster & Milwaukee Llc
Bought by
8800 Milwaukee Llc
Current Estimated Value
Purchase Details
Closed on
Jul 26, 2002
Sold by
Sfirnaciuc Modest and Sfirnaciuc Elena
Bought by
Lopez Mauricio R
Home Financials for this Owner
Home Financials are based on the most recent Mortgage that was taken out on this home.
Original Mortgage
$151,900
Interest Rate
6.56%
Purchase Details
Closed on
Mar 15, 2002
Sold by
Hussein Mohammad
Bought by
Sfirnaciuc Modest and Sfirnaciuc Elena
Purchase Details
Closed on
Jun 5, 2000
Sold by
Shaikh Khaled Al
Bought by
Hussein Mohammed
Purchase Details
Closed on
Oct 22, 1997
Sold by
Apostol Louis G and Kennedy William
Bought by
Alshaikh Khaled
Home Financials for this Owner
Home Financials are based on the most recent Mortgage that was taken out on this home.
Original Mortgage
$35,750
Interest Rate
13.49%
Create a Home Valuation Report for This Property
The Home Valuation Report is an in-depth analysis detailing your home's value as well as a comparison with similar homes in the area
Home Values in the Area
Average Home Value in this Area
Purchase History
| Date | Buyer | Sale Price | Title Company |
|---|---|---|---|
| 8800 Milwaukee Llc | $1,400,000 | Cti | |
| Lopez Mauricio R | $152,000 | -- | |
| Sfirnaciuc Modest | $82,000 | -- | |
| Hussein Mohammed | -- | -- | |
| Alshaikh Khaled | $55,000 | -- |
Source: Public Records
Mortgage History
| Date | Status | Borrower | Loan Amount |
|---|---|---|---|
| Previous Owner | Lopez Mauricio R | $151,900 | |
| Previous Owner | Alshaikh Khaled | $35,750 |
Source: Public Records
Tax History Compared to Growth
Tax History
| Year | Tax Paid | Tax Assessment Tax Assessment Total Assessment is a certain percentage of the fair market value that is determined by local assessors to be the total taxable value of land and additions on the property. | Land | Improvement |
|---|---|---|---|---|
| 2024 | $2,903 | $17,001 | $1,563 | $15,438 |
| 2023 | $2,809 | $17,000 | $2,656 | $14,344 |
| 2022 | $2,809 | $17,000 | $2,656 | $14,344 |
| 2021 | $2,749 | $16,999 | $2,656 | $14,343 |
| 2020 | $1,856 | $11,381 | $2,656 | $8,725 |
| 2019 | $1,922 | $12,934 | $2,656 | $10,278 |
| 2018 | $1,889 | $12,934 | $2,656 | $10,278 |
| 2017 | $1,636 | $10,926 | $2,343 | $8,583 |
| 2016 | $1,699 | $10,926 | $2,343 | $8,583 |
| 2015 | $1,533 | $10,926 | $2,343 | $8,583 |
| 2014 | $1,484 | $10,504 | $2,187 | $8,317 |
| 2013 | $1,444 | $10,504 | $2,187 | $8,317 |
Source: Public Records
Map
Nearby Homes
- 3349 W 60th Place
- 3341 W 62nd St
- 3501 W 61st Place
- 3502 W 58th Place
- 2711 W 59th St
- 6011 S Albany Ave
- 5730 S Trumbull Ave
- 6241 S Troy St
- 5707 S Spaulding Ave
- 5706 S Sawyer Ave
- 3710 W 60th Place
- 3709 W 59th Place
- 3529 W 63rd Place
- 6155 S Whipple St
- 3331 W 64th St
- 6319 S Troy St
- 6113 S Sacramento Ave
- 3219 W 64th St
- 3416 W 64th Place
- 3745 W 59th Place
- 3350 W 60th Place
- 3342 W 60th Place
- 3352 W 60th Place
- 3340 W 60th Place
- 3356 W 60th Place
- 3338 W 60th Place
- 3334 W 60th Place
- 3349 W 60th St
- 3347 W 60th St
- 3351 W 60th St
- 3332 W 60th Place
- 3343 W 60th St
- 3353 W 60th St
- 3357 W 60th St
- 3339 W 60th St
- 3330 W 60th Place
- 3337 W 60th St
- 3400 W 60th Place
- 3351 W 60th Place
- 3328 W 60th Place