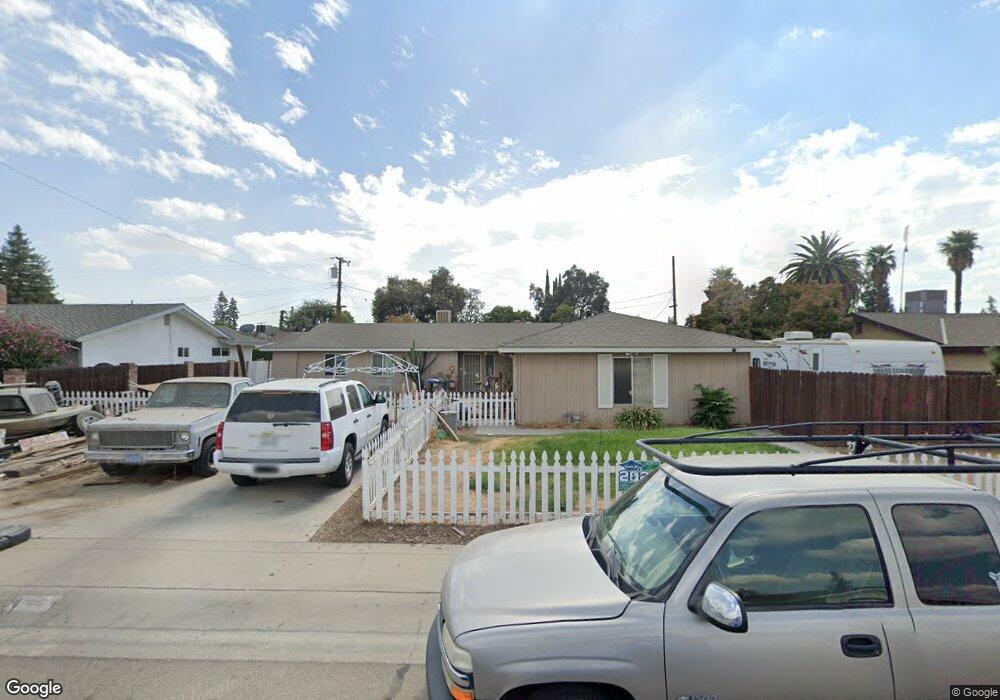
3349 W Royal Oaks Dr Visalia, CA 93277
Mooney NeighborhoodEstimated Value: $420,860 - $514,000
4
Beds
3
Baths
2,095
Sq Ft
$216/Sq Ft
Est. Value
About This Home
This home is located at 3349 W Royal Oaks Dr, Visalia, CA 93277 and is currently estimated at $452,965, approximately $216 per square foot. 3349 W Royal Oaks Dr is a home located in Tulare County with nearby schools including Royal Oaks Elementary School, Green Acres Middle School, and Mt. Whitney High School.
Ownership History
Date
Name
Owned For
Owner Type
Purchase Details
Closed on
May 15, 2009
Sold by
Federal Home Loan Mortgage Corporation
Bought by
Smith Glenn R
Current Estimated Value
Purchase Details
Closed on
May 11, 2009
Sold by
Smith Vanessa
Bought by
Smith Glenn R
Purchase Details
Closed on
Mar 17, 2009
Sold by
Adolfo Edwin
Bought by
Federal Home Loan Mortgage Corporation
Purchase Details
Closed on
Apr 26, 2006
Sold by
Berry Margaret L
Bought by
Adolfo Edwin
Home Financials for this Owner
Home Financials are based on the most recent Mortgage that was taken out on this home.
Original Mortgage
$248,000
Interest Rate
7%
Mortgage Type
Purchase Money Mortgage
Purchase Details
Closed on
Oct 11, 2004
Sold by
Berry Shirley M
Bought by
Berry Shirley M and Shirley M Berry Living Trust
Create a Home Valuation Report for This Property
The Home Valuation Report is an in-depth analysis detailing your home's value as well as a comparison with similar homes in the area
Home Values in the Area
Average Home Value in this Area
Purchase History
| Date | Buyer | Sale Price | Title Company |
|---|---|---|---|
| Smith Glenn R | $168,000 | Lsi Title | |
| Smith Glenn R | -- | Lsi Title | |
| Federal Home Loan Mortgage Corporation | $184,000 | Accommodation | |
| Adolfo Edwin | $310,000 | Fidelity Natl Title Co Of Ca | |
| Berry Shirley M | -- | -- |
Source: Public Records
Mortgage History
| Date | Status | Borrower | Loan Amount |
|---|---|---|---|
| Previous Owner | Adolfo Edwin | $248,000 |
Source: Public Records
Tax History Compared to Growth
Tax History
| Year | Tax Paid | Tax Assessment Tax Assessment Total Assessment is a certain percentage of the fair market value that is determined by local assessors to be the total taxable value of land and additions on the property. | Land | Improvement |
|---|---|---|---|---|
| 2025 | $2,208 | $216,345 | $45,072 | $171,273 |
| 2024 | $2,208 | $212,104 | $44,189 | $167,915 |
| 2023 | $2,146 | $207,946 | $43,323 | $164,623 |
| 2022 | $2,049 | $203,870 | $42,474 | $161,396 |
| 2021 | $2,050 | $199,872 | $41,641 | $158,231 |
| 2020 | $2,032 | $197,823 | $41,214 | $156,609 |
| 2019 | $1,973 | $193,944 | $40,406 | $153,538 |
| 2018 | $1,921 | $190,141 | $39,614 | $150,527 |
| 2017 | $1,900 | $186,412 | $38,837 | $147,575 |
| 2016 | $1,863 | $182,756 | $38,075 | $144,681 |
| 2015 | $1,807 | $180,011 | $37,503 | $142,508 |
| 2014 | $1,807 | $176,484 | $36,768 | $139,716 |
Source: Public Records
Map
Nearby Homes
- 3125 W Howard Ave
- 3708 W Paradise Ave
- 1834 S Redwood St
- 3515 W Iris Ave
- 1937 S Royal Oaks Dr
- 3804 W Judy Ave
- 3425 W Laurel Ave
- 3124 W Tulare Ave
- 3504 W Cutler Ave
- 1127 S Whitney Dr
- 1138 S Valley St
- 4024 W Howard Ave
- 1633 S Chinowth St
- 1330 S Clover St
- 3924 W Fairhaven Ave
- 3116 W Beech Ave
- 2219 S Linda Vista St
- 2419 W Harvard Ave
- 820 S Chinowth St Unit 93
- 820 S Chinowth St Unit 72
- 3339 W Royal Oaks Dr
- 3419 W Royal Oaks Dr
- 3340 W Harvard Ct
- 3350 W Harvard Ct
- 3435 W Royal Oaks Dr
- 3348 W Royal Oaks Dr
- 3325 W Royal Oaks Dr
- 3400 W Mccormick Dr
- 1707 S Wellsley Ct
- 1539 Radcliffe Ct
- 3326 W Harvard Ct
- 3434 W Royal Oaks Dr
- 3447 W Royal Oaks Dr
- 1700 S Wellsley Ct
- 3349 W Harvard Ct
- 3412 W Mccormick Dr
- 1525 Radcliffe Ct
- 3312 W Harvard Ct
- 1711 S Wellsley Ct
- 1546 S Wellsley St