Estimated Value: $110,212 - $195,000
--
Bed
--
Bath
1,000
Sq Ft
$161/Sq Ft
Est. Value
About This Home
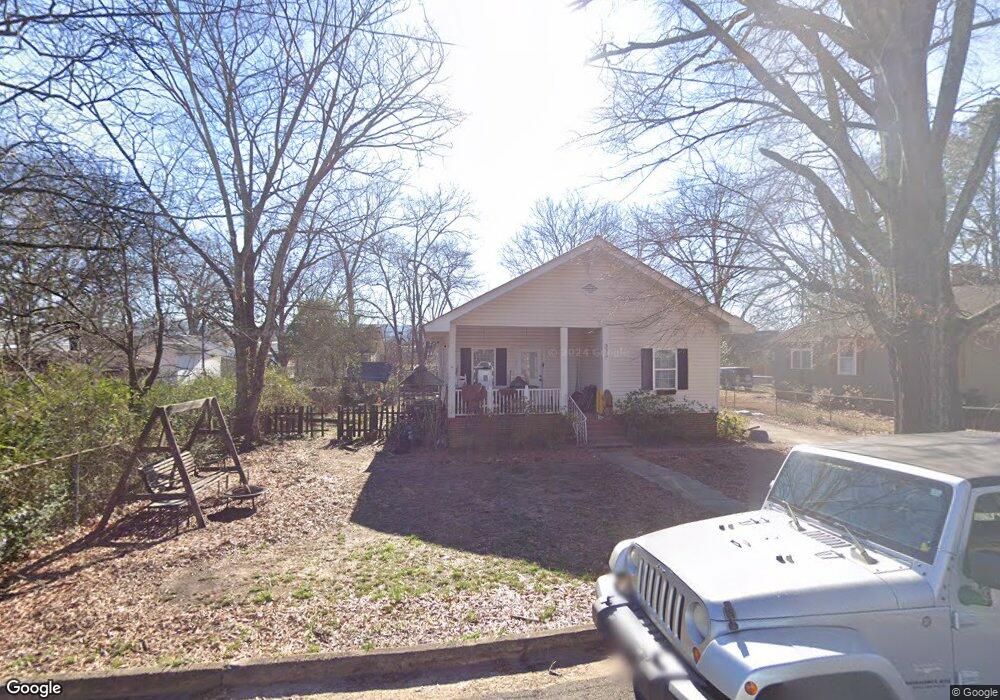
This home is located at 335 2nd Shannon St NE, Rome, GA 30161 and is currently estimated at $161,303, approximately $161 per square foot. 335 2nd Shannon St NE is a home with nearby schools including Model Middle School and Model High School.
Ownership History
Date
Name
Owned For
Owner Type
Purchase Details
Closed on
Apr 30, 2008
Sold by
Not Provided
Bought by
Fallin William B and Fallin Margaret C Cole
Current Estimated Value
Purchase Details
Closed on
Oct 24, 2007
Sold by
Not Provided
Bought by
Fallin William B and Fallin Margaret C Cole
Purchase Details
Closed on
Jul 24, 2007
Sold by
Not Provided
Bought by
Fallin William B and Fallin Margaret C Cole
Purchase Details
Closed on
Feb 19, 1982
Bought by
P and R
Purchase Details
Closed on
Feb 22, 1978
Sold by
Boatwright Alton Franklin
Bought by
Boatwright Patricia Murphy
Purchase Details
Closed on
Apr 10, 1972
Sold by
Crider Paul L
Bought by
Boatwright Alton Franklin
Purchase Details
Closed on
Jan 17, 1968
Sold by
Momon Momon J and Momon Emma B
Bought by
Crider Paul L
Purchase Details
Closed on
Feb 26, 1963
Sold by
Willbanks Faynell S
Bought by
Momon Momon J and Momon Emma B
Purchase Details
Closed on
Jan 1, 1961
Bought by
Willbanks Faynell S
Create a Home Valuation Report for This Property
The Home Valuation Report is an in-depth analysis detailing your home's value as well as a comparison with similar homes in the area
Home Values in the Area
Average Home Value in this Area
Purchase History
| Date | Buyer | Sale Price | Title Company |
|---|---|---|---|
| Fallin William B | $76,500 | -- | |
| Fallin William B | $76,500 | -- | |
| Fallin William B | $17,500 | -- | |
| Fallin William B | $15,000 | -- | |
| P | -- | -- | |
| Boatwright Patricia Murphy | -- | -- | |
| Boatwright Alton Franklin | $10,000 | -- | |
| Crider Paul L | $6,000 | -- | |
| Momon Momon J | $7,000 | -- | |
| Willbanks Faynell S | -- | -- |
Source: Public Records
Tax History Compared to Growth
Tax History
| Year | Tax Paid | Tax Assessment Tax Assessment Total Assessment is a certain percentage of the fair market value that is determined by local assessors to be the total taxable value of land and additions on the property. | Land | Improvement |
|---|---|---|---|---|
| 2024 | $756 | $31,515 | $4,467 | $27,048 |
| 2023 | $747 | $30,448 | $3,970 | $26,478 |
| 2022 | $681 | $25,536 | $3,226 | $22,310 |
| 2021 | $568 | $20,654 | $3,226 | $17,428 |
| 2020 | $526 | $19,210 | $2,482 | $16,728 |
| 2019 | $496 | $18,492 | $2,482 | $16,010 |
| 2018 | $505 | $18,787 | $2,482 | $16,305 |
| 2017 | $494 | $18,384 | $2,482 | $15,902 |
| 2016 | $560 | $20,360 | $2,480 | $17,880 |
| 2015 | $570 | $20,680 | $2,480 | $18,200 |
| 2014 | $570 | $20,680 | $2,480 | $18,200 |
Source: Public Records
Map
Nearby Homes
- 255 E 2nd St NE
- 320 Shannon Rd NE
- 430 Third St
- 535 1st St NE
- 635 E 3rd St
- 841 Shannon Cir NE
- 4th Shannon Cir NE
- 814 Shannon Cir NE
- 00 Todd St NE
- 50 Round Rock Cir NE
- 56 Lull Rd NE
- 59 Round Rock Cir NE
- 320 Old Shannon Rd NE
- 6 Keystone Ln NE
- 129 Pierce Hill Rd NE
- 107 Winsome Place NE
- 16 Cinnamon Ln NE
- 1055 E Hermitage Rd NE
- 7 Thrushwood Rd NE
- 1225 Rush Chapel Rd NE
- 345 2nd Shannon St NE
- 315 2nd St NE
- 330 2nd Shannon St NE
- 355 2nd Shannon St NE
- 340 2nd Shannon St NE
- 320 2nd Shannon St NE
- 315 Second St
- 320 1st St NE
- 330 1st St NE
- 310 E 2nd St
- 340 1st St NE
- 350 Second St
- 350 2nd Shannon St
- 310 1st St NE
- 365 2nd Shannon St NE
- 350 1st St NE
- 360 2nd St Shannon Unit 103
- 300 2nd Shannon St NE
- 375 E 2nd St NE
- 300 1st St NE