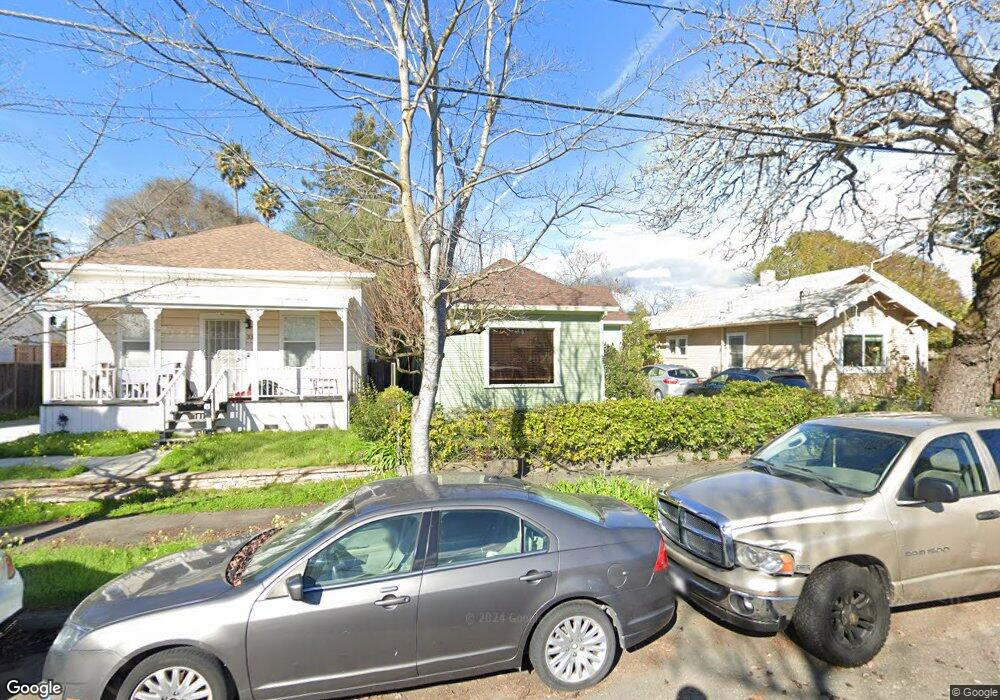
335 Boyce St Santa Rosa, CA 95401
Historic Railroad Square NeighborhoodEstimated Value: $503,000 - $592,000
2
Beds
1
Bath
936
Sq Ft
$575/Sq Ft
Est. Value
About This Home
This home is located at 335 Boyce St, Santa Rosa, CA 95401 and is currently estimated at $538,295, approximately $575 per square foot. 335 Boyce St is a home located in Sonoma County with nearby schools including Abraham Lincoln Elementary School, Santa Rosa Middle School, and Santa Rosa High School.
Ownership History
Date
Name
Owned For
Owner Type
Purchase Details
Closed on
Jun 29, 2020
Sold by
Raabe Joel and Broderick Sarah
Bought by
Raabe Joel
Current Estimated Value
Home Financials for this Owner
Home Financials are based on the most recent Mortgage that was taken out on this home.
Original Mortgage
$275,100
Outstanding Balance
$243,940
Interest Rate
3.1%
Mortgage Type
New Conventional
Estimated Equity
$294,355
Purchase Details
Closed on
Oct 23, 2014
Sold by
Jean O Connor Robert R and Connor Blake Jean O
Bought by
Raabe Joel and Broderick Sarah
Home Financials for this Owner
Home Financials are based on the most recent Mortgage that was taken out on this home.
Original Mortgage
$307,200
Interest Rate
4.2%
Mortgage Type
New Conventional
Purchase Details
Closed on
Nov 13, 2012
Sold by
Roy O Connor Robert R and Connor Robert Roy O
Bought by
Jean O Connor Robert R and Oconnor Blake Jean O
Create a Home Valuation Report for This Property
The Home Valuation Report is an in-depth analysis detailing your home's value as well as a comparison with similar homes in the area
Home Values in the Area
Average Home Value in this Area
Purchase History
| Date | Buyer | Sale Price | Title Company |
|---|---|---|---|
| Raabe Joel | -- | Title365 | |
| Raabe Joel | $384,000 | Old Republic Title Company | |
| Jean O Connor Robert R | -- | None Available |
Source: Public Records
Mortgage History
| Date | Status | Borrower | Loan Amount |
|---|---|---|---|
| Open | Raabe Joel | $275,100 | |
| Previous Owner | Raabe Joel | $307,200 |
Source: Public Records
Tax History
| Year | Tax Paid | Tax Assessment Tax Assessment Total Assessment is a certain percentage of the fair market value that is determined by local assessors to be the total taxable value of land and additions on the property. | Land | Improvement |
|---|---|---|---|---|
| 2025 | $5,134 | $461,501 | $180,271 | $281,230 |
| 2024 | $5,134 | $452,453 | $176,737 | $275,716 |
| 2023 | $5,134 | $443,582 | $173,272 | $270,310 |
| 2022 | $4,739 | $434,885 | $169,875 | $265,010 |
| 2021 | $4,680 | $426,359 | $166,545 | $259,814 |
| 2020 | $4,669 | $421,988 | $164,838 | $257,150 |
| 2019 | $4,643 | $413,714 | $161,606 | $252,108 |
| 2018 | $4,617 | $405,603 | $158,438 | $247,165 |
| 2017 | $4,533 | $397,651 | $155,332 | $242,319 |
| 2016 | $4,498 | $389,855 | $152,287 | $237,568 |
| 2015 | $4,361 | $384,000 | $150,000 | $234,000 |
| 2014 | $2,175 | $195,149 | $84,182 | $110,967 |
Source: Public Records
Map
Nearby Homes
- 303 Boyce St
- 158 N Dutton Ave Unit 4
- 1035 Maxwell Dr
- 595 N Dutton Ave
- 930 Morgan St Unit 3
- 1127 Cleveland Ave
- 220 Carrillo St
- 786 Simpson Place
- 432 8th St
- 547 B St
- 100 Ridgway Ave
- 1555 W 3rd St
- 312 Benton St
- 717 Blair Place
- 588 Roseland Ave
- 107 Sebastopol Ave
- 724 Agnew Place
- 77 Romani Ct
- 62 Romani Ct
- 300 Stony Point Rd Unit 126
Your Personal Tour Guide
Ask me questions while you tour the home.