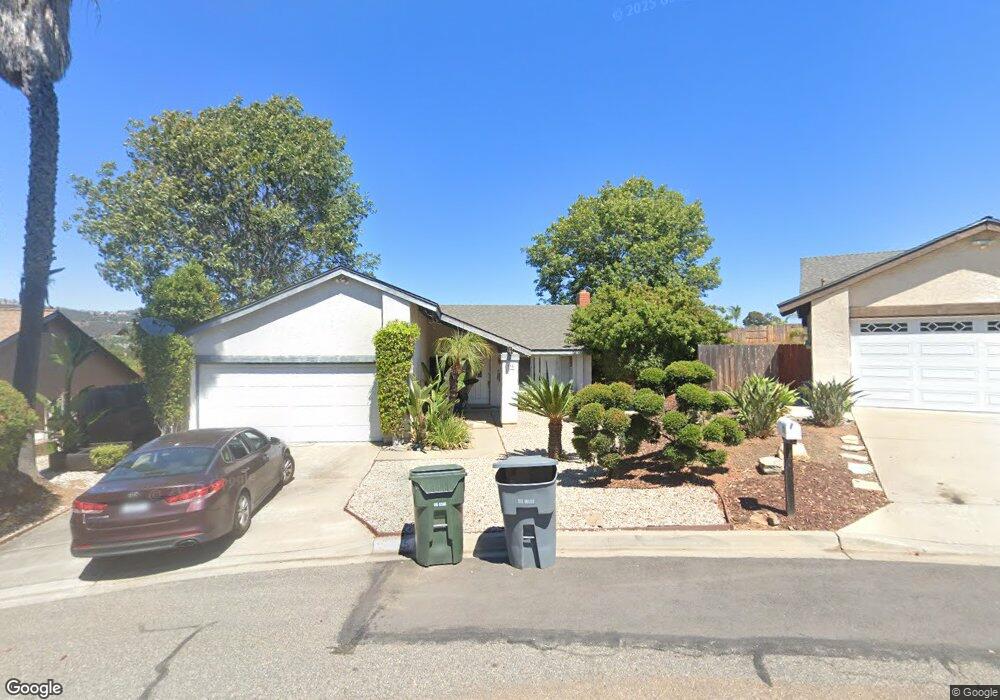
335 Camino Redondo San Marcos, CA 92069
Estimated Value: $725,043 - $821,000
3
Beds
2
Baths
1,260
Sq Ft
$614/Sq Ft
Est. Value
About This Home
This home is located at 335 Camino Redondo, San Marcos, CA 92069 and is currently estimated at $773,761, approximately $614 per square foot. 335 Camino Redondo is a home located in San Diego County with nearby schools including Knob Hill Elementary School, Woodland Park Middle School, and Mission Hills High School.
Ownership History
Date
Name
Owned For
Owner Type
Purchase Details
Closed on
Jun 18, 2015
Sold by
Vanhouten David and Van Houten Juliane
Bought by
The Van Houten Revocable Living Trust and Vanhouten Juliane P
Current Estimated Value
Purchase Details
Closed on
Mar 5, 1997
Sold by
Howe Barbara A
Bought by
Vanhouten David and Vanhouten Juliane
Home Financials for this Owner
Home Financials are based on the most recent Mortgage that was taken out on this home.
Original Mortgage
$122,350
Outstanding Balance
$14,692
Interest Rate
7.63%
Estimated Equity
$759,069
Purchase Details
Closed on
Sep 20, 1996
Sold by
Howe Bruce
Bought by
Howe Barbara A
Purchase Details
Closed on
Aug 5, 1996
Sold by
Grove Park Homeowners Protective Assn
Bought by
Howe Barbara A and Howe Bruce
Purchase Details
Closed on
May 15, 1995
Sold by
Grove Park Homeowners Protective Assn
Bought by
Grove Park Homeowners Protective Assn
Purchase Details
Closed on
May 20, 1988
Create a Home Valuation Report for This Property
The Home Valuation Report is an in-depth analysis detailing your home's value as well as a comparison with similar homes in the area
Home Values in the Area
Average Home Value in this Area
Purchase History
| Date | Buyer | Sale Price | Title Company |
|---|---|---|---|
| The Van Houten Revocable Living Trust | -- | None Available | |
| Vanhouten David | $136,000 | First American Title | |
| Howe Barbara A | -- | -- | |
| Howe Barbara A | -- | -- | |
| Grove Park Homeowners Protective Assn | $3,992 | Benefit Land Title Company | |
| -- | $117,500 | -- |
Source: Public Records
Mortgage History
| Date | Status | Borrower | Loan Amount |
|---|---|---|---|
| Open | Vanhouten David | $122,350 |
Source: Public Records
Tax History Compared to Growth
Tax History
| Year | Tax Paid | Tax Assessment Tax Assessment Total Assessment is a certain percentage of the fair market value that is determined by local assessors to be the total taxable value of land and additions on the property. | Land | Improvement |
|---|---|---|---|---|
| 2025 | $2,899 | $221,471 | $112,468 | $109,003 |
| 2024 | $2,899 | $217,129 | $110,263 | $106,866 |
| 2023 | $2,854 | $212,872 | $108,101 | $104,771 |
| 2022 | $2,821 | $208,699 | $105,982 | $102,717 |
| 2021 | $2,783 | $204,607 | $103,904 | $100,703 |
| 2020 | $2,761 | $202,510 | $102,839 | $99,671 |
| 2019 | $2,736 | $198,540 | $100,823 | $97,717 |
| 2018 | $2,664 | $194,648 | $98,847 | $95,801 |
| 2017 | $2,621 | $190,832 | $96,909 | $93,923 |
| 2016 | $2,587 | $187,091 | $95,009 | $92,082 |
| 2015 | $2,557 | $184,281 | $93,582 | $90,699 |
| 2014 | -- | $180,672 | $91,749 | $88,923 |
Source: Public Records
Map
Nearby Homes
- 1120 Grape St
- 1477 Glen Avon Dr
- 213 Woodland Pkwy Unit 210
- 227 Woodland Pkwy Unit 163
- 1145 Privet St
- 204 Cerco Rosado
- 214 Woodland Pkwy Unit 206
- 254 Cerco Rosado
- 275 Richland Rd
- 1524 Brook Rd
- 2012 Mountain Laurel Rd
- 1804 Mountain Laurel Rd
- 2004 Mountain Laurel Rd
- 639 Butterwood Ave
- 1145 E Barham Dr Unit 15
- 1145 E Barham Dr Unit 204
- 1145 E Barham Dr Unit 180
- 1145 E Barham Dr Unit 132
- 1145 E Barham Dr Unit 100
- 1145 E Barham Dr Unit SPC 149
- 333 Camino Redondo
- 1165 Sutter Ln
- 1155 Sutter Ln
- 1175 Sutter Ln
- 331 Camino Redondo
- 339 Camino Redondo
- 332 Camino Redondo
- 1145 Sutter Ln
- 1185 Sutter Ln
- 338 Rueda Margarita
- 1194 Via Teresa
- 334 Camino Redondo
- 341 Camino Redondo
- 1135 Sutter Ln
- 330 Camino Redondo
- 336 Rueda Margarita
- 1198 Via Teresa
- 1205 Sutter Ln
- 340 Rueda Margarita
- 1180 Via Teresa Unit 3