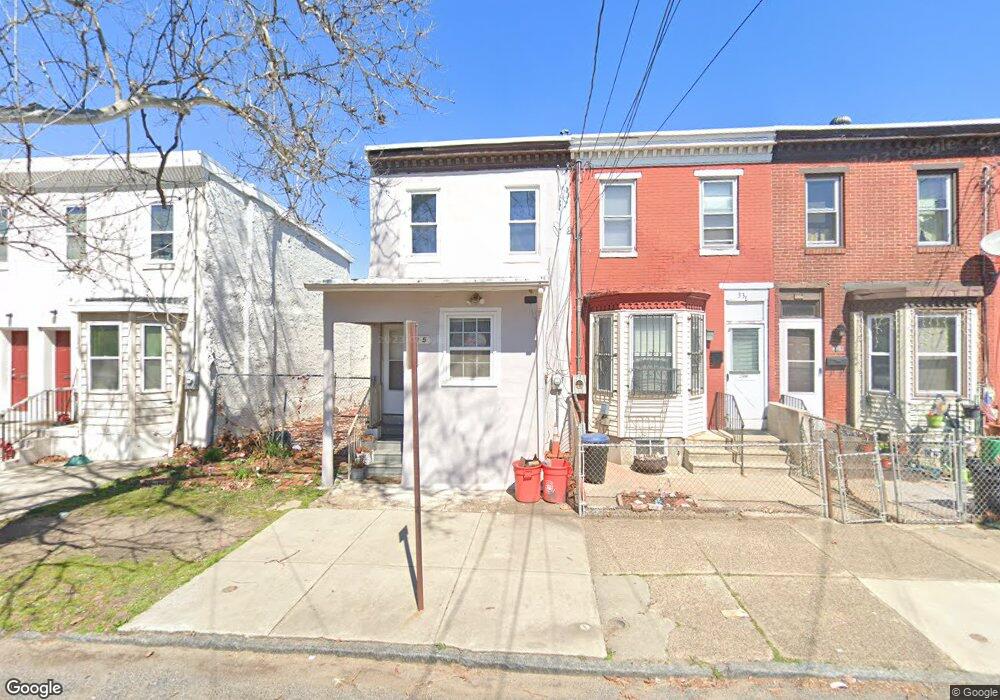
335 Clinton St Camden, NJ 08103
Lanning Square NeighborhoodEstimated Value: $79,407 - $147,000
--
Bed
--
Bath
1,052
Sq Ft
$108/Sq Ft
Est. Value
About This Home
This home is located at 335 Clinton St, Camden, NJ 08103 and is currently estimated at $113,102, approximately $107 per square foot. 335 Clinton St is a home located in Camden County with nearby schools including Camden High School, Hope Community Charter School, and Leap Academy University Charter School.
Ownership History
Date
Name
Owned For
Owner Type
Purchase Details
Closed on
Nov 22, 2013
Sold by
Herrera Ricardo and Salas Ramiro
Bought by
Herrera Ricardo
Current Estimated Value
Purchase Details
Closed on
May 2, 2008
Sold by
Koche Steven
Bought by
Herrera Richardo and Salas Ramino
Purchase Details
Closed on
Jun 14, 2002
Sold by
Hallman John
Bought by
Feliciano Edith
Home Financials for this Owner
Home Financials are based on the most recent Mortgage that was taken out on this home.
Original Mortgage
$36,920
Interest Rate
6.79%
Mortgage Type
FHA
Create a Home Valuation Report for This Property
The Home Valuation Report is an in-depth analysis detailing your home's value as well as a comparison with similar homes in the area
Home Values in the Area
Average Home Value in this Area
Purchase History
| Date | Buyer | Sale Price | Title Company |
|---|---|---|---|
| Herrera Ricardo | -- | None Available | |
| Herrera Richardo | $20,000 | -- | |
| Feliciano Edith | $37,500 | -- |
Source: Public Records
Mortgage History
| Date | Status | Borrower | Loan Amount |
|---|---|---|---|
| Previous Owner | Feliciano Edith | $36,920 |
Source: Public Records
Tax History Compared to Growth
Tax History
| Year | Tax Paid | Tax Assessment Tax Assessment Total Assessment is a certain percentage of the fair market value that is determined by local assessors to be the total taxable value of land and additions on the property. | Land | Improvement |
|---|---|---|---|---|
| 2025 | $1,031 | $29,100 | $5,800 | $23,300 |
| 2024 | $997 | $29,100 | $5,800 | $23,300 |
| 2023 | $997 | $29,100 | $5,800 | $23,300 |
| 2022 | $978 | $29,100 | $5,800 | $23,300 |
| 2021 | $975 | $29,100 | $5,800 | $23,300 |
| 2020 | $925 | $29,100 | $5,800 | $23,300 |
| 2019 | $886 | $29,100 | $5,800 | $23,300 |
| 2018 | $881 | $29,100 | $5,800 | $23,300 |
| 2017 | $860 | $29,100 | $5,800 | $23,300 |
| 2016 | $833 | $29,100 | $5,800 | $23,300 |
| 2015 | $801 | $29,100 | $5,800 | $23,300 |
| 2014 | $782 | $29,100 | $5,800 | $23,300 |
Source: Public Records
Map
Nearby Homes