B
Seller's Agent in 2015
Brad Parker
Century 21 Root Agency
Estimated Value: $558,000 - $709,000
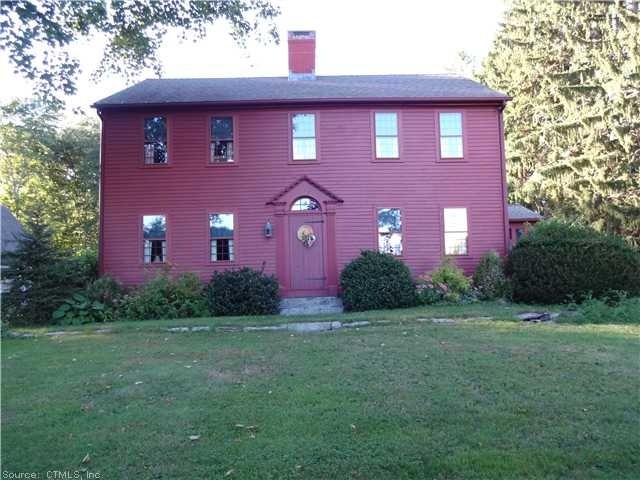
Well maintained colonial built in 1784 -- 3 bedrooms and 2 bathscenter chimney - central air - large sunroom - screened in porch and stone patio with 3 car garage all on 6 acres property includes map #76 lot #s 110 and 111
Last Agent to Sell the Property
Brad Parker
Century 21 Root Agency License #RES.0759694 Listed on: 09/16/2014
Last Buyer's Agent
Roland Harris
Coldwell Banker Realty License #RES.0796534
| Date | Buyer | Sale Price | Title Company |
|---|---|---|---|
| Gembel John | -- | -- | |
| Gembel John | $47,500 | -- | |
| Gembel John | $47,500 | -- | |
| Gembel John | $345,000 | -- | |
| Gembel John | $345,000 | -- |
| Date | Status | Borrower | Loan Amount |
|---|---|---|---|
| Previous Owner | Gembel John | $338,725 |
| Date | Event | Price | List to Sale | Price per Sq Ft |
|---|---|---|---|---|
| 12/02/2015 12/02/15 | Sold | $345,000 | -8.0% | $153 / Sq Ft |
| 10/18/2015 10/18/15 | Pending | -- | -- | -- |
| 09/16/2014 09/16/14 | For Sale | $375,000 | -- | $166 / Sq Ft |
| Year | Tax Paid | Tax Assessment Tax Assessment Total Assessment is a certain percentage of the fair market value that is determined by local assessors to be the total taxable value of land and additions on the property. | Land | Improvement |
|---|---|---|---|---|
| 2025 | $9,368 | $333,870 | $76,480 | $257,390 |
| 2024 | $8,934 | $333,870 | $76,480 | $257,390 |
| 2023 | $8,597 | $333,870 | $76,480 | $257,390 |
| 2022 | $7,788 | $244,970 | $55,270 | $189,700 |
| 2021 | $7,321 | $240,490 | $55,270 | $185,220 |
| 2020 | $7,321 | $240,490 | $55,270 | $185,220 |
| 2019 | $7,321 | $240,490 | $55,270 | $185,220 |
| 2018 | $7,133 | $240,490 | $55,270 | $185,220 |
| 2017 | $5,552 | $187,710 | $58,770 | $128,940 |
| 2016 | $5,509 | $187,710 | $58,770 | $128,940 |
| 2015 | $5,310 | $185,150 | $56,210 | $128,940 |
| 2014 | $5,166 | $185,150 | $56,210 | $128,940 |
B
Seller's Agent in 2015
Brad Parker
Century 21 Root Agency
R
Buyer's Agent in 2015
Roland Harris
Coldwell Banker Realty
Source: SmartMLS
MLS Number: N354983
APN: EHDM-000076M-000000-L000111
Disclaimer: Certain information contained herein is derived from information provided by parties other than Homes.com. All information provided is deemed reliable, but is not guaranteed to be accurate and should be independently verified.
![]() IDX information is provided exclusively for personal, non-commercial use, and may not be used for any purpose other than to identify prospective properties consumers may be interested in purchasing. Information is deemed reliable but not guaranteed.
IDX information is provided exclusively for personal, non-commercial use, and may not be used for any purpose other than to identify prospective properties consumers may be interested in purchasing. Information is deemed reliable but not guaranteed.