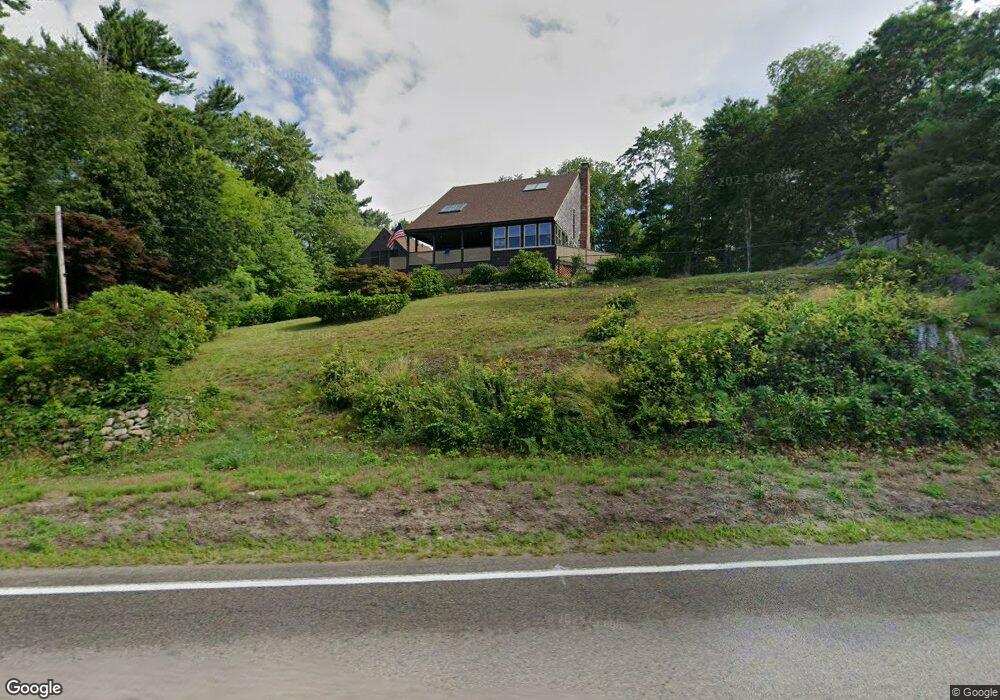
335 Maquan St Hanson, MA 02341
Estimated Value: $557,000 - $594,619
2
Beds
2
Baths
1,344
Sq Ft
$432/Sq Ft
Est. Value
About This Home
This home is located at 335 Maquan St, Hanson, MA 02341 and is currently estimated at $580,905, approximately $432 per square foot. 335 Maquan St is a home located in Plymouth County.
Ownership History
Date
Name
Owned For
Owner Type
Purchase Details
Closed on
Oct 14, 2010
Sold by
Comis Charles C and Keene Cynthia
Bought by
Bemis Mark W and Bemis Judith M
Current Estimated Value
Home Financials for this Owner
Home Financials are based on the most recent Mortgage that was taken out on this home.
Original Mortgage
$291,127
Outstanding Balance
$192,211
Interest Rate
4.36%
Mortgage Type
Purchase Money Mortgage
Estimated Equity
$388,694
Purchase Details
Closed on
Aug 5, 2004
Sold by
Comis Barbara R and Comis Charles C
Bought by
Comis Charles C and Comis Barbara R
Create a Home Valuation Report for This Property
The Home Valuation Report is an in-depth analysis detailing your home's value as well as a comparison with similar homes in the area
Home Values in the Area
Average Home Value in this Area
Purchase History
| Date | Buyer | Sale Price | Title Company |
|---|---|---|---|
| Bemis Mark W | $142,500 | -- | |
| Bemis Mark W | $142,500 | -- | |
| Comis Charles C | -- | -- |
Source: Public Records
Mortgage History
| Date | Status | Borrower | Loan Amount |
|---|---|---|---|
| Open | Bemis Mark W | $291,127 | |
| Previous Owner | Comis Charles C | $10,000 |
Source: Public Records
Tax History Compared to Growth
Tax History
| Year | Tax Paid | Tax Assessment Tax Assessment Total Assessment is a certain percentage of the fair market value that is determined by local assessors to be the total taxable value of land and additions on the property. | Land | Improvement |
|---|---|---|---|---|
| 2025 | $6,768 | $505,800 | $162,900 | $342,900 |
| 2024 | $6,147 | $459,400 | $158,200 | $301,200 |
| 2023 | $5,973 | $421,200 | $158,200 | $263,000 |
| 2022 | $5,724 | $379,300 | $143,800 | $235,500 |
| 2021 | $5,010 | $331,800 | $138,300 | $193,500 |
| 2020 | $4,896 | $320,600 | $133,600 | $187,000 |
| 2019 | $4,403 | $283,500 | $131,000 | $152,500 |
| 2018 | $4,318 | $272,800 | $126,000 | $146,800 |
| 2017 | $4,184 | $261,800 | $120,000 | $141,800 |
| 2016 | $4,232 | $255,700 | $120,000 | $135,700 |
| 2015 | $4,018 | $252,400 | $120,000 | $132,400 |
Source: Public Records
Map
Nearby Homes
- 134 Crescent St
- 456 Maquan St
- 269 Lakeside Rd
- 456 Gorwin Dr
- 22 Pondview Ave
- 23 Pondview Ave
- 8 Pinehurst Ave
- Lot 2 Harvard Rd
- Lot 6 Way
- 37 Brook St
- 18 Wampatuck St
- 15 Elm Place
- 842 E Washington St
- 10 Warren Terrace
- 6 Evan Rd
- 57 Liberty St
- 418 E Washington St
- 248 E Washington St
- 479 Main St
- 5 Hatch Rd
- 341 Maquan St
- 315 Maquan St
- 357 Maquan St
- 293 Maquan St
- 75 Wilkie Terrace
- 11 Wilkie Terrace
- 359 Maquan St
- 120 Crescent St
- 7 Wilkie Terrace
- 7 Wilkie Terrace Unit TERRRACE
- 82 Crescent St
- 70 Wilkie Terrace
- 144 Crescent St
- 162 Crescent St
- 188 Crescent St
- 367 Maquan St
- 20 Woodman Terrace
- 208 Crescent St
- 218 Crescent St
- 199 Crescent St