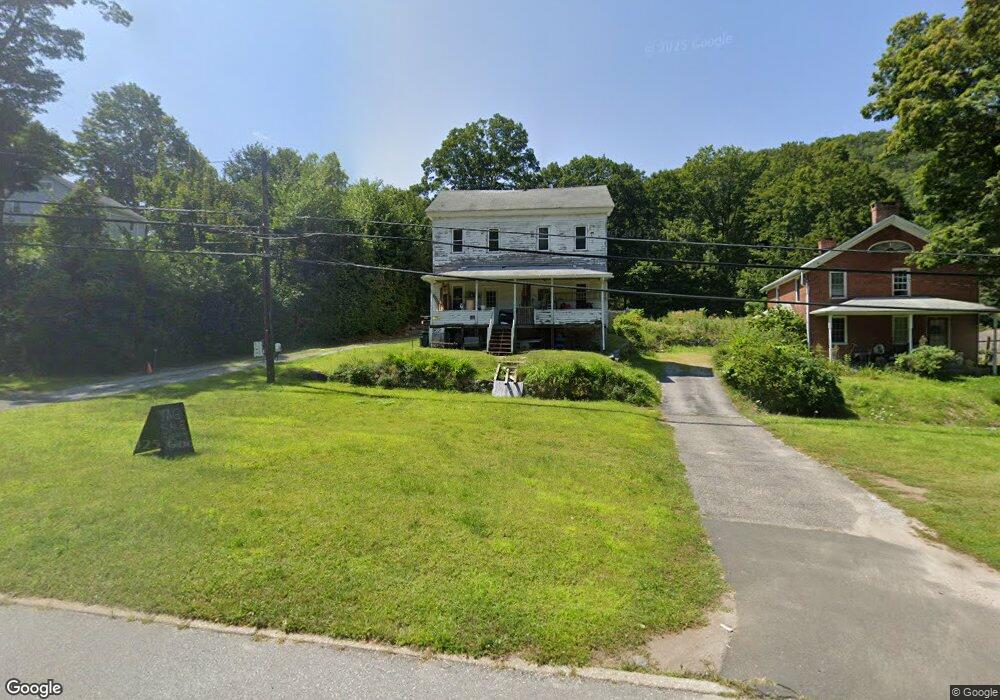
335 N Main St Winsted, CT 06098
Estimated Value: $190,000 - $251,000
4
Beds
3
Baths
1,920
Sq Ft
$109/Sq Ft
Est. Value
About This Home
This home is located at 335 N Main St, Winsted, CT 06098 and is currently estimated at $209,261, approximately $108 per square foot. 335 N Main St is a home located in Litchfield County with nearby schools including Pearson School and St Anthony School.
Ownership History
Date
Name
Owned For
Owner Type
Purchase Details
Closed on
Apr 11, 2013
Sold by
Russell Abigail L
Bought by
Rubens Jonathan H
Current Estimated Value
Purchase Details
Closed on
Oct 5, 2005
Sold by
Petrunti Louis
Bought by
Suscietto Abigail R
Home Financials for this Owner
Home Financials are based on the most recent Mortgage that was taken out on this home.
Original Mortgage
$60,000
Interest Rate
5.81%
Create a Home Valuation Report for This Property
The Home Valuation Report is an in-depth analysis detailing your home's value as well as a comparison with similar homes in the area
Home Values in the Area
Average Home Value in this Area
Purchase History
| Date | Buyer | Sale Price | Title Company |
|---|---|---|---|
| Rubens Jonathan H | $70,000 | -- | |
| Rubens Jonathan H | $70,000 | -- | |
| Suscietto Abigail R | $75,000 | -- | |
| Suscietto Abigail R | $75,000 | -- |
Source: Public Records
Mortgage History
| Date | Status | Borrower | Loan Amount |
|---|---|---|---|
| Previous Owner | Suscietto Abigail R | $50,000 | |
| Previous Owner | Suscietto Abigail R | $60,000 | |
| Previous Owner | Suscietto Abigail R | $145,000 |
Source: Public Records
Tax History Compared to Growth
Tax History
| Year | Tax Paid | Tax Assessment Tax Assessment Total Assessment is a certain percentage of the fair market value that is determined by local assessors to be the total taxable value of land and additions on the property. | Land | Improvement |
|---|---|---|---|---|
| 2025 | $1,572 | $53,900 | $26,810 | $27,090 |
| 2024 | $1,468 | $53,900 | $26,810 | $27,090 |
| 2023 | $1,422 | $53,900 | $26,810 | $27,090 |
| 2022 | $1,705 | $50,820 | $19,530 | $31,290 |
| 2021 | $1,705 | $50,820 | $19,530 | $31,290 |
| 2020 | $1,705 | $50,820 | $19,530 | $31,290 |
| 2019 | $1,705 | $50,820 | $19,530 | $31,290 |
| 2018 | $1,705 | $50,820 | $19,530 | $31,290 |
| 2017 | $1,338 | $39,900 | $19,530 | $20,370 |
| 2016 | $1,338 | $39,900 | $19,530 | $20,370 |
| 2015 | $1,305 | $39,900 | $19,530 | $20,370 |
| 2014 | $1,273 | $39,900 | $19,530 | $20,370 |
Source: Public Records
Map
Nearby Homes