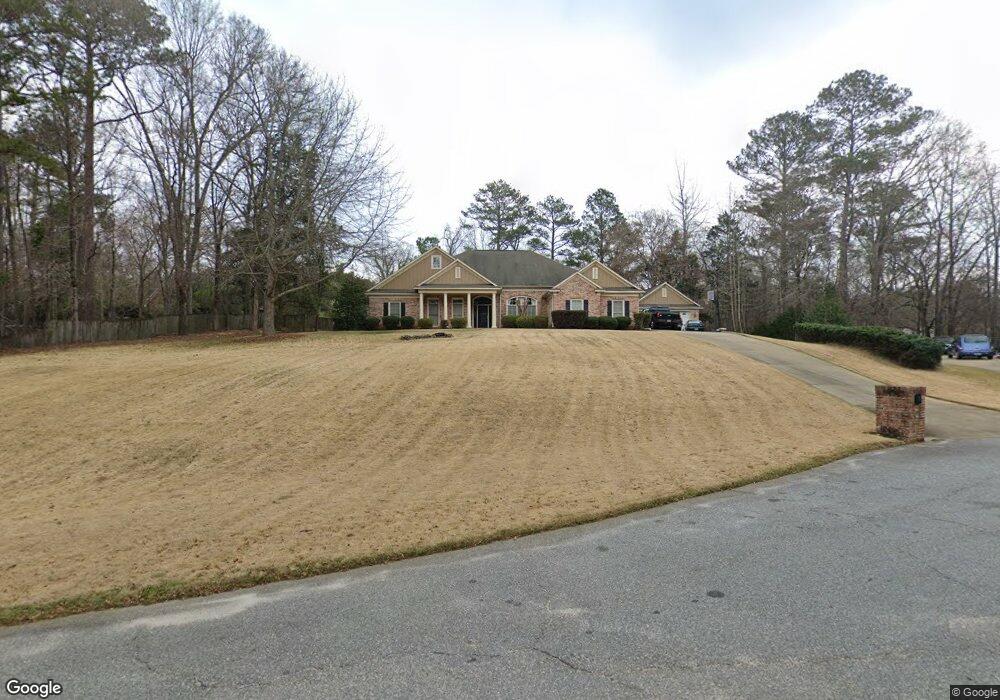
335 Otter Dr Cataula, GA 31804
Estimated Value: $493,000 - $634,000
4
Beds
4
Baths
3,606
Sq Ft
$163/Sq Ft
Est. Value
About This Home
This home is located at 335 Otter Dr, Cataula, GA 31804 and is currently estimated at $589,023, approximately $163 per square foot. 335 Otter Dr is a home located in Harris County with nearby schools including Mulberry Creek Elementary School, Cogburn Woods Elementary School, and Harris County Carver Middle School.
Ownership History
Date
Name
Owned For
Owner Type
Purchase Details
Closed on
Apr 16, 2008
Sold by
Wells Barry Harper
Bought by
Williams Arnetta L
Current Estimated Value
Home Financials for this Owner
Home Financials are based on the most recent Mortgage that was taken out on this home.
Original Mortgage
$451,378
Outstanding Balance
$283,985
Interest Rate
5.84%
Mortgage Type
New Conventional
Estimated Equity
$305,038
Purchase Details
Closed on
Mar 28, 2006
Sold by
Wells Construction Co
Bought by
Wells Barry Harper
Home Financials for this Owner
Home Financials are based on the most recent Mortgage that was taken out on this home.
Original Mortgage
$360,000
Interest Rate
6.75%
Mortgage Type
New Conventional
Purchase Details
Closed on
Jul 15, 2005
Sold by
Harris Developers Llc
Bought by
Wells Construction Co
Home Financials for this Owner
Home Financials are based on the most recent Mortgage that was taken out on this home.
Original Mortgage
$70,000
Interest Rate
5.59%
Mortgage Type
New Conventional
Create a Home Valuation Report for This Property
The Home Valuation Report is an in-depth analysis detailing your home's value as well as a comparison with similar homes in the area
Home Values in the Area
Average Home Value in this Area
Purchase History
| Date | Buyer | Sale Price | Title Company |
|---|---|---|---|
| Williams Arnetta L | $425,000 | -- | |
| Wells Barry Harper | -- | -- | |
| Wells Construction Co | $70,000 | -- |
Source: Public Records
Mortgage History
| Date | Status | Borrower | Loan Amount |
|---|---|---|---|
| Open | Williams Arnetta L | $451,378 | |
| Previous Owner | Wells Barry Harper | $360,000 | |
| Previous Owner | Wells Construction Co | $70,000 |
Source: Public Records
Tax History Compared to Growth
Tax History
| Year | Tax Paid | Tax Assessment Tax Assessment Total Assessment is a certain percentage of the fair market value that is determined by local assessors to be the total taxable value of land and additions on the property. | Land | Improvement |
|---|---|---|---|---|
| 2024 | $5,458 | $199,351 | $24,480 | $174,871 |
| 2023 | $5,085 | $185,359 | $24,480 | $160,879 |
| 2022 | $5,085 | $185,359 | $24,480 | $160,879 |
| 2021 | $5,144 | $180,702 | $24,480 | $156,222 |
| 2020 | $5,144 | $180,702 | $24,480 | $156,222 |
| 2019 | $4,963 | $180,702 | $24,480 | $156,222 |
| 2018 | $5,062 | $180,702 | $24,480 | $156,222 |
| 2017 | $5,064 | $180,702 | $24,480 | $156,222 |
| 2016 | $4,599 | $180,162 | $24,480 | $155,682 |
| 2015 | $4,608 | $180,162 | $24,480 | $155,682 |
| 2014 | $4,617 | $180,162 | $24,480 | $155,682 |
| 2013 | -- | $180,162 | $24,480 | $155,682 |
Source: Public Records
Map
Nearby Homes
- 511 Sweetwater Dr
- 509 Sweetwater Dr
- 72 Mountain Lake Ct
- 95 Sweetwater Ct
- 508 Sweetwater Dr
- 218 E East Bonacre Rd
- 131 Old Gate Rd
- 654 Grey Rock Rd
- 1278 Jones Rd
- 172-6 Almond Ridge Dr
- 8000 Ivy Park Dr
- 492 Mulberry Crossing Dr
- 595 Grey Rock Dr
- 654 Grey Rock Dr
- 5905 Linley Ct
- 9536 English Ivy Ct
- 4677 Ivy Patch Dr
- 921 Grey Smoke Trail
- 3860 Essex Heights Trail
- 9410 Forest Crown Dr