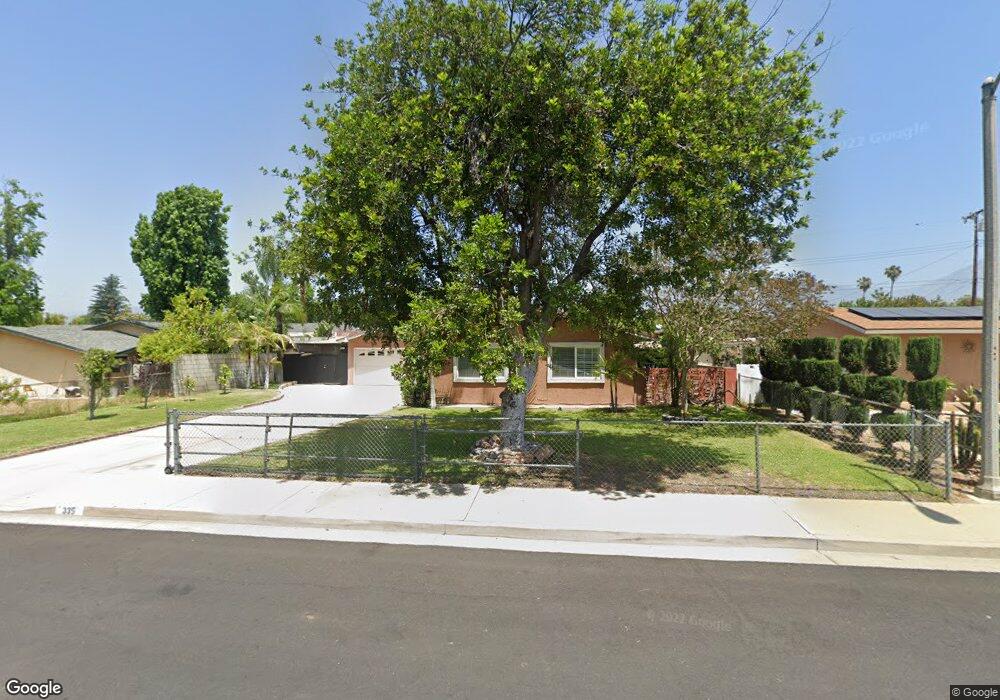
335 Verdugo Ave Pomona, CA 91767
Pomona Valley NeighborhoodEstimated Value: $623,000 - $733,000
3
Beds
2
Baths
1,170
Sq Ft
$575/Sq Ft
Est. Value
About This Home
This home is located at 335 Verdugo Ave, Pomona, CA 91767 and is currently estimated at $672,205, approximately $574 per square foot. 335 Verdugo Ave is a home located in Los Angeles County with nearby schools including Harrison Elementary School, Palomares Academy Of Health Science, and Pomona High School.
Ownership History
Date
Name
Owned For
Owner Type
Purchase Details
Closed on
Mar 14, 2018
Sold by
Peraza Elmer Roberto
Bought by
Peraza Elmer Roberto and Peraza Melvy
Current Estimated Value
Purchase Details
Closed on
Jul 7, 2005
Sold by
Peraza Elmer Roberto
Bought by
Peraza Elmer Roberto and Peraza Melvy
Home Financials for this Owner
Home Financials are based on the most recent Mortgage that was taken out on this home.
Original Mortgage
$146,300
Outstanding Balance
$75,827
Interest Rate
5.55%
Mortgage Type
New Conventional
Estimated Equity
$596,378
Purchase Details
Closed on
Oct 14, 2002
Sold by
Peraza Elmer Roberto
Bought by
Peraza Elmer Roberto and Peraza Melvy
Home Financials for this Owner
Home Financials are based on the most recent Mortgage that was taken out on this home.
Original Mortgage
$95,500
Interest Rate
6.09%
Purchase Details
Closed on
Jun 15, 2000
Sold by
Reynolds Hal
Bought by
Reynolds Terry and Reynolds Kathryn
Create a Home Valuation Report for This Property
The Home Valuation Report is an in-depth analysis detailing your home's value as well as a comparison with similar homes in the area
Home Values in the Area
Average Home Value in this Area
Purchase History
| Date | Buyer | Sale Price | Title Company |
|---|---|---|---|
| Peraza Elmer Roberto | -- | None Available | |
| Peraza Elmer Roberto | -- | Fidelity National Title | |
| Peraza Elmer Roberto | -- | Fidelity National Title | |
| Peraza Elmer Roberto | -- | Fidelity National Title | |
| Reynolds Terry | $550,000 | First American Title |
Source: Public Records
Mortgage History
| Date | Status | Borrower | Loan Amount |
|---|---|---|---|
| Open | Peraza Elmer Roberto | $146,300 | |
| Closed | Peraza Elmer Roberto | $95,500 |
Source: Public Records
Tax History Compared to Growth
Tax History
| Year | Tax Paid | Tax Assessment Tax Assessment Total Assessment is a certain percentage of the fair market value that is determined by local assessors to be the total taxable value of land and additions on the property. | Land | Improvement |
|---|---|---|---|---|
| 2025 | $2,180 | $154,661 | $60,932 | $93,729 |
| 2024 | $2,180 | $151,630 | $59,738 | $91,892 |
| 2023 | $2,136 | $148,658 | $58,567 | $90,091 |
| 2022 | $2,099 | $145,744 | $57,419 | $88,325 |
| 2021 | $2,046 | $142,888 | $56,294 | $86,594 |
| 2019 | $2,079 | $138,652 | $54,625 | $84,027 |
| 2018 | $1,864 | $135,934 | $53,554 | $82,380 |
| 2016 | $1,745 | $130,657 | $51,475 | $79,182 |
| 2015 | $1,729 | $128,695 | $50,702 | $77,993 |
| 2014 | $1,723 | $126,175 | $49,709 | $76,466 |
Source: Public Records
Map
Nearby Homes
- 323 Fanshaw Ave
- 222 E Foothill Blvd
- 176 Whitney Ave Unit 2
- 327 Flaxton St
- 3069 Carrizo Dr
- 2901 Huston St
- 3073 Gladstone St
- 2904 Sterling St
- 131 Carrotwood Ln
- 301 E Foothill Blvd Unit 34
- 301 E Foothill Blvd Unit 24
- 301 E Foothill Blvd Unit 58
- 301 E Foothill Blvd Unit 63
- 301 E Foothill Blvd
- 301 E Foothill Blvd Unit 80
- 301 E Foothill Blvd Unit 59
- 121 N Town Ave
- 117 N Town Ave
- 109 N Town Ave
- 797 Plum Ln
- 325 Verdugo Ave
- 347 Verdugo Ave
- 334 Valera Ave
- 322 Valera Ave
- 346 Valera Ave
- 355 Verdugo Ave
- 3010 Vamana St
- 340 Verdugo Ave
- 354 Valera Ave
- 348 Verdugo Ave
- 373 Verdugo Ave
- 3027 Vamana St
- 3035 Vamana St
- 3019 Vamana St
- 370 Valera Ave
- 356 Verdugo Ave
- 3002 Vamana St
- 333 Valera Ave
- 3043 Vamana St
- 345 Valera Ave