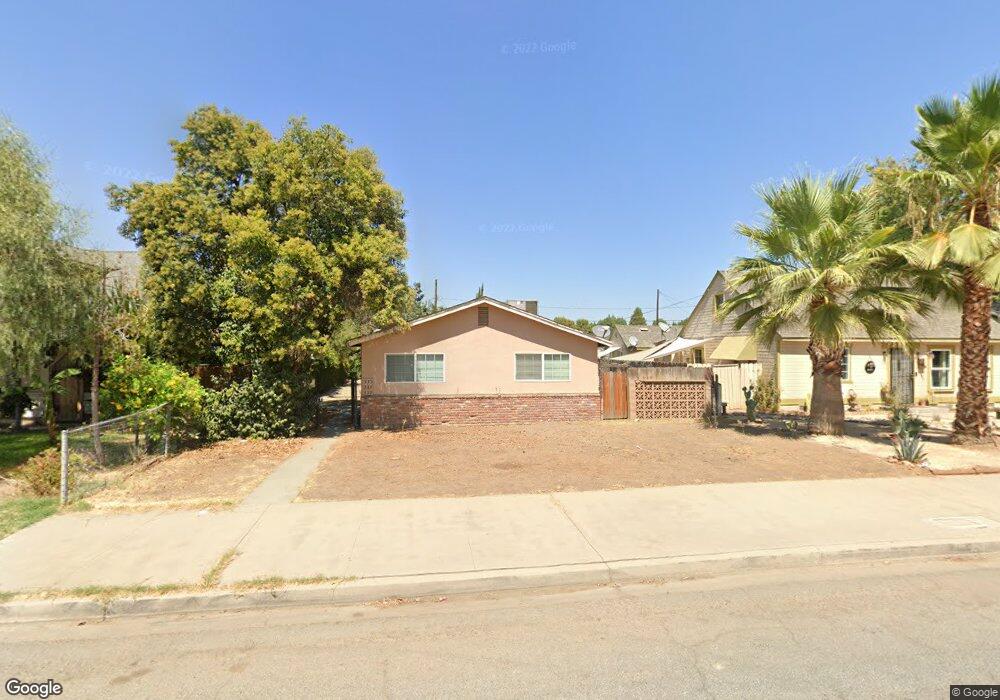
335 W Palm St Exeter, CA 93221
Estimated Value: $297,000 - $412,000
6
Beds
3
Baths
760
Sq Ft
$463/Sq Ft
Est. Value
About This Home
This home is located at 335 W Palm St, Exeter, CA 93221 and is currently estimated at $351,523, approximately $462 per square foot. 335 W Palm St is a home located in Tulare County with nearby schools including Sierra View Junior Academy.
Ownership History
Date
Name
Owned For
Owner Type
Purchase Details
Closed on
Jul 6, 2005
Sold by
Early Michael
Bought by
Early Michael and Early Kimberly
Current Estimated Value
Home Financials for this Owner
Home Financials are based on the most recent Mortgage that was taken out on this home.
Original Mortgage
$210,000
Outstanding Balance
$108,558
Interest Rate
5.51%
Mortgage Type
Fannie Mae Freddie Mac
Estimated Equity
$242,965
Purchase Details
Closed on
Mar 26, 2004
Sold by
Vanness Harry E
Bought by
Vanness Jeffrey and Vanness Harry E
Purchase Details
Closed on
Apr 11, 2002
Sold by
Rozsa Tibor
Bought by
Early Michael and Early Kimberly
Home Financials for this Owner
Home Financials are based on the most recent Mortgage that was taken out on this home.
Original Mortgage
$72,050
Interest Rate
6.52%
Purchase Details
Closed on
Dec 30, 1994
Sold by
Rozsa Tibor
Bought by
Rozsa Tibor and Rozsa Julianna
Create a Home Valuation Report for This Property
The Home Valuation Report is an in-depth analysis detailing your home's value as well as a comparison with similar homes in the area
Home Values in the Area
Average Home Value in this Area
Purchase History
| Date | Buyer | Sale Price | Title Company |
|---|---|---|---|
| Early Michael | -- | Fidelity Natl Title Co Of Ca | |
| Vanness Jeffrey | -- | Fidelity National Title | |
| Early Michael | $91,500 | First American Title Co | |
| Rozsa Tibor | -- | -- |
Source: Public Records
Mortgage History
| Date | Status | Borrower | Loan Amount |
|---|---|---|---|
| Open | Early Michael | $210,000 | |
| Previous Owner | Early Michael | $72,050 | |
| Closed | Early Michael | $10,000 |
Source: Public Records
Tax History
| Year | Tax Paid | Tax Assessment Tax Assessment Total Assessment is a certain percentage of the fair market value that is determined by local assessors to be the total taxable value of land and additions on the property. | Land | Improvement |
|---|---|---|---|---|
| 2025 | $1,452 | $131,799 | $36,207 | $95,592 |
| 2024 | $1,452 | $129,216 | $35,498 | $93,718 |
| 2023 | $1,415 | $126,683 | $34,802 | $91,881 |
| 2022 | $1,386 | $124,200 | $34,120 | $90,080 |
| 2021 | $1,375 | $121,765 | $33,451 | $88,314 |
| 2020 | $1,353 | $120,516 | $33,108 | $87,408 |
| 2019 | $1,313 | $118,153 | $32,459 | $85,694 |
| 2018 | $1,265 | $115,837 | $31,823 | $84,014 |
| 2017 | $1,241 | $113,566 | $31,199 | $82,367 |
| 2016 | $1,204 | $111,339 | $30,587 | $80,752 |
| 2015 | $1,193 | $109,667 | $30,128 | $79,539 |
| 2014 | $1,193 | $107,519 | $29,538 | $77,981 |
Source: Public Records
Map
Nearby Homes
- 137 N H St
- 447 W Maple St
- 457 W Maple St
- 570 Little Ln
- 229 S I St
- 314 N Albert Ave Unit 132
- 314 N Albert Ave Unit 39
- 314 N Albert Ave Unit 1
- 314 N Albert Ave Unit 42
- 314 N Albert Ave Unit 73
- 314 N Albert Ave Unit 101
- 264 S Orange Ave
- 606 N Orange Ave
- 233 N C St
- 316 Peach Dr
- 208 N B St
- 200 N B St
- 210 Sequoia Dr
- Ave 276 Avenue 276
- 813 W Willow St
- 329 W Palm St
- 341 W Palm St
- 317 W Palm St
- 317 Palm
- 332 W Visalia Rd
- 324 W Visalia Rd
- 241 N Quince Ave
- 206 N Filbert Rd
- 210 N Filbert Rd
- 316 W Visalia Rd
- 202 N Filbert Rd
- 324 W Palm St
- 401 W Palm St
- 308 W Visalia Rd
- 409 W Palm St
- 157 N Quince Ave
- 268 N Filbert Rd
- 415 W Palm St
- 170 N Filbert Rd
- 154 N Filbert Rd
Your Personal Tour Guide
Ask me questions while you tour the home.