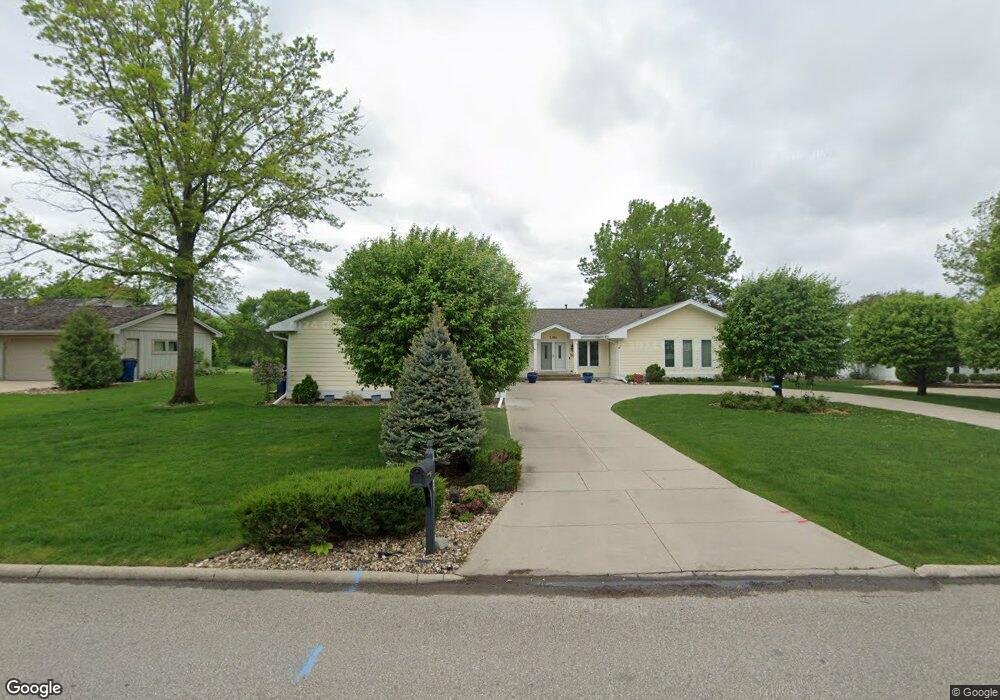
3350 Inverness Rd Waterloo, IA 50701
Estimated Value: $490,000 - $760,000
3
Beds
4
Baths
4,006
Sq Ft
$163/Sq Ft
Est. Value
About This Home
This home is located at 3350 Inverness Rd, Waterloo, IA 50701 and is currently estimated at $653,195, approximately $163 per square foot. 3350 Inverness Rd is a home located in Black Hawk County with nearby schools including Lou Henry Elementary School, Hoover Middle School, and West High School.
Ownership History
Date
Name
Owned For
Owner Type
Purchase Details
Closed on
May 28, 2013
Sold by
Cortright Kevan J and Cortright Shelley R
Bought by
Lane Mark G and Lane Lisa K
Current Estimated Value
Home Financials for this Owner
Home Financials are based on the most recent Mortgage that was taken out on this home.
Original Mortgage
$360,000
Outstanding Balance
$254,825
Interest Rate
3.38%
Mortgage Type
New Conventional
Estimated Equity
$398,371
Purchase Details
Closed on
Apr 19, 2011
Sold by
Lohnes Donald J
Bought by
Cortright Kevan J and Cortright Shelley R
Home Financials for this Owner
Home Financials are based on the most recent Mortgage that was taken out on this home.
Original Mortgage
$425,000
Interest Rate
4.92%
Mortgage Type
Credit Line Revolving
Purchase Details
Closed on
Jan 18, 2005
Sold by
Lohnes Donald J and Lohnes Vernie H
Bought by
Lohnes Vernie H
Create a Home Valuation Report for This Property
The Home Valuation Report is an in-depth analysis detailing your home's value as well as a comparison with similar homes in the area
Home Values in the Area
Average Home Value in this Area
Purchase History
| Date | Buyer | Sale Price | Title Company |
|---|---|---|---|
| Lane Mark G | $450,000 | None Available | |
| Cortright Kevan J | $450,000 | None Available | |
| Lohnes Vernie H | -- | None Available |
Source: Public Records
Mortgage History
| Date | Status | Borrower | Loan Amount |
|---|---|---|---|
| Open | Lane Mark G | $360,000 | |
| Previous Owner | Cortright Kevan J | $425,000 |
Source: Public Records
Tax History Compared to Growth
Tax History
| Year | Tax Paid | Tax Assessment Tax Assessment Total Assessment is a certain percentage of the fair market value that is determined by local assessors to be the total taxable value of land and additions on the property. | Land | Improvement |
|---|---|---|---|---|
| 2024 | $14,286 | $668,740 | $66,090 | $602,650 |
| 2023 | $9,828 | $668,740 | $66,090 | $602,650 |
| 2022 | $9,566 | $456,390 | $66,090 | $390,300 |
| 2021 | $10,448 | $456,390 | $66,090 | $390,300 |
| 2020 | $10,274 | $469,850 | $66,090 | $403,760 |
| 2019 | $10,274 | $469,850 | $66,090 | $403,760 |
| 2018 | $9,322 | $426,810 | $66,090 | $360,720 |
| 2017 | $9,606 | $426,810 | $66,090 | $360,720 |
| 2016 | $9,682 | $426,810 | $66,090 | $360,720 |
| 2015 | $9,682 | $426,810 | $66,090 | $360,720 |
| 2014 | $9,868 | $426,810 | $66,090 | $360,720 |
Source: Public Records
Map
Nearby Homes
- 3329 Lincolnshire Rd
- 3335 Lincolnshire Rd
- 3325 Lincolnshire Rd
- 0 Provision Pkwy
- Village West 2nd Addn Lot 2
- 629 Jane St
- 1306 Olympic Dr
- 0 Hwy 63 Land Unit NBR20254281
- 1132 W Ridgeway Ave
- Lot 4 Marnie Ave
- Lot 3 Marnie Ave
- Lot 2 Marnie Ave
- Lot 1 Marnie Ave
- Lot 7 Kimberly Ln
- Lot 11 Kimberly Ln
- Lot 9 Kimberly Ln
- Lot 1 Kimberly Ln
- Lot 8 Kimberly Ln
- Lot 6 Kimberly Ln
- Lot 5 Kimberly Ln
- 3364 Inverness Rd
- 3334 Inverness Rd
- 3351 Inverness Rd
- 3339 Inverness Rd
- 3365 Inverness Rd
- 3335 Inverness Rd
- 3320 Inverness Rd
- 3375 Inverness Rd
- 3321 Inverness Rd
- 3404 Inverness Rd
- 3556 Muirfield Dr
- 3306 Inverness Rd
- 3405 Doral Dr
- 3556 Turnberry Dr
- 3405 Inverness Rd
- 3547 Turnberry Dr
- 3396 W Ridge Dr
- 3553 Muirfield Dr
- 3417 Doral Dr
- 3416 Inverness Rd