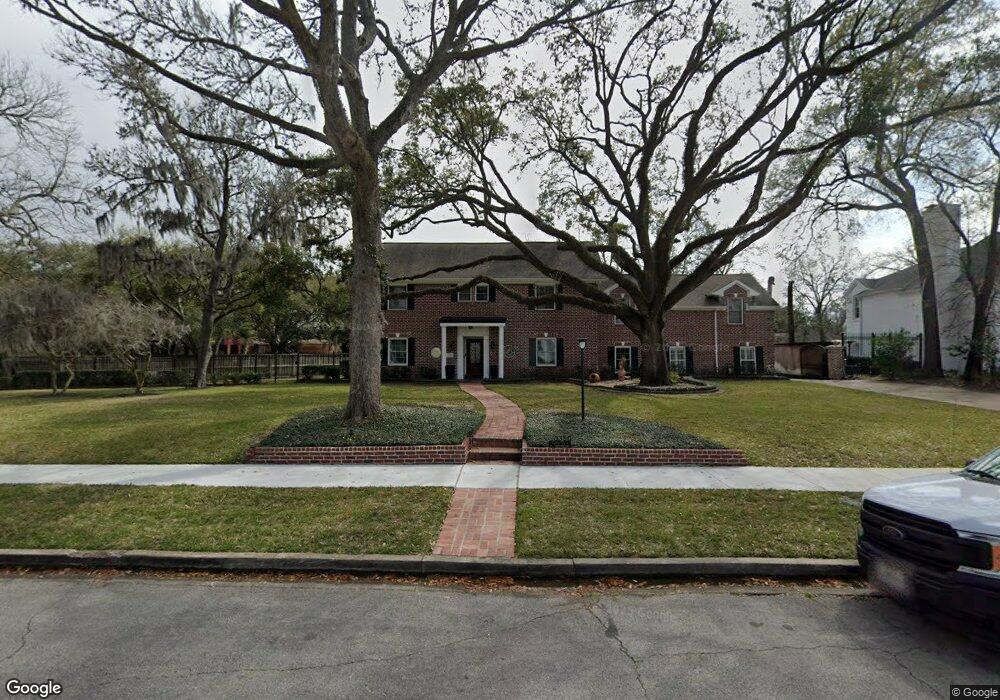
3350 Parkwood Dr Houston, TX 77021
MacGregor NeighborhoodEstimated Value: $737,000 - $924,000
4
Beds
4
Baths
3,585
Sq Ft
$234/Sq Ft
Est. Value
About This Home
This home is located at 3350 Parkwood Dr, Houston, TX 77021 and is currently estimated at $840,572, approximately $234 per square foot. 3350 Parkwood Dr is a home located in Harris County with nearby schools including Thompson Elementary School, Cullen Middle School, and Yates High School.
Ownership History
Date
Name
Owned For
Owner Type
Purchase Details
Closed on
Aug 25, 2000
Sold by
Mullins Eric D and Mullins Annette L
Bought by
Harris Dwayne and Harris Paula
Current Estimated Value
Home Financials for this Owner
Home Financials are based on the most recent Mortgage that was taken out on this home.
Original Mortgage
$31,000
Outstanding Balance
$11,346
Interest Rate
8.16%
Estimated Equity
$829,226
Purchase Details
Closed on
Dec 8, 1995
Sold by
Aristizabal George H and Aristizabal Susan M
Bought by
Mullins Eric D and Mullins Harold
Home Financials for this Owner
Home Financials are based on the most recent Mortgage that was taken out on this home.
Original Mortgage
$35,000
Interest Rate
7.41%
Purchase Details
Closed on
May 8, 1995
Sold by
Steakley Barbara Elizabeth and Frazier Suzanne Elaine Steakley
Bought by
Mullins Eric D and Mullins Annette L
Home Financials for this Owner
Home Financials are based on the most recent Mortgage that was taken out on this home.
Original Mortgage
$129,600
Interest Rate
8.36%
Create a Home Valuation Report for This Property
The Home Valuation Report is an in-depth analysis detailing your home's value as well as a comparison with similar homes in the area
Home Values in the Area
Average Home Value in this Area
Purchase History
| Date | Buyer | Sale Price | Title Company |
|---|---|---|---|
| Harris Dwayne | -- | Chicago Title Insurance Co | |
| Mullins Eric D | -- | -- | |
| Mullins Eric D | -- | -- |
Source: Public Records
Mortgage History
| Date | Status | Borrower | Loan Amount |
|---|---|---|---|
| Open | Harris Dwayne | $31,000 | |
| Previous Owner | Mullins Eric D | $35,000 | |
| Previous Owner | Mullins Eric D | $129,600 |
Source: Public Records
Tax History Compared to Growth
Tax History
| Year | Tax Paid | Tax Assessment Tax Assessment Total Assessment is a certain percentage of the fair market value that is determined by local assessors to be the total taxable value of land and additions on the property. | Land | Improvement |
|---|---|---|---|---|
| 2025 | $12,161 | $830,557 | $282,600 | $547,957 |
| 2024 | $12,161 | $830,557 | $282,600 | $547,957 |
| 2023 | $12,161 | $757,000 | $282,600 | $474,400 |
| 2022 | $16,138 | $820,559 | $282,600 | $537,959 |
| 2021 | $14,759 | $633,235 | $200,175 | $433,060 |
| 2020 | $15,220 | $600,000 | $200,175 | $399,825 |
| 2019 | $14,550 | $600,000 | $200,175 | $399,825 |
| 2018 | $9,870 | $500,000 | $117,750 | $382,250 |
| 2017 | $12,359 | $500,000 | $117,750 | $382,250 |
| 2016 | $13,218 | $500,000 | $117,750 | $382,250 |
| 2015 | $8,739 | $500,000 | $117,750 | $382,250 |
| 2014 | $8,739 | $431,438 | $117,750 | $313,688 |
Source: Public Records
Map
Nearby Homes
- 3415 Charleston St
- 3417 Charleston St
- 3530 Griggs Rd
- 3449 N Parkwood Dr
- 3379 Tampa St
- 3523 Tampa St
- 3371 Dixie Dr
- 3221 N Macgregor Way
- 3226 Milburn St
- 3343 Dixie Dr
- 3217 Parkwood Dr
- 3539 Tampa St
- 3368 Dixie Dr
- 3551 Tampa St
- 6324 Del Rio St
- 6411 Illinois St
- 3702 Charleston St
- 3202 Parkwood Dr
- 6348 Culberson St
- 6350 Culberson St
- 3346 Parkwood Dr
- 3359 Charleston St
- 3316 Parkwood Dr
- 3344 Parkwood Dr
- 3343 Parkwood Dr
- 3345 Parkwood Dr
- 3339 Parkwood Dr
- 3340 Parkwood Dr
- 3337 Parkwood Dr
- 3347 Charleston St
- 3342 S Macgregor Way
- 3338 Parkwood Dr
- 3335 Parkwood Dr
- 3403 N Parkwood Dr
- 3345 Charleston St
- 3340 S Macgregor Way
- 3336 Parkwood Dr
- 3331 Parkwood Dr
- 3334 S Macgregor Way
- 3403 Charleston St