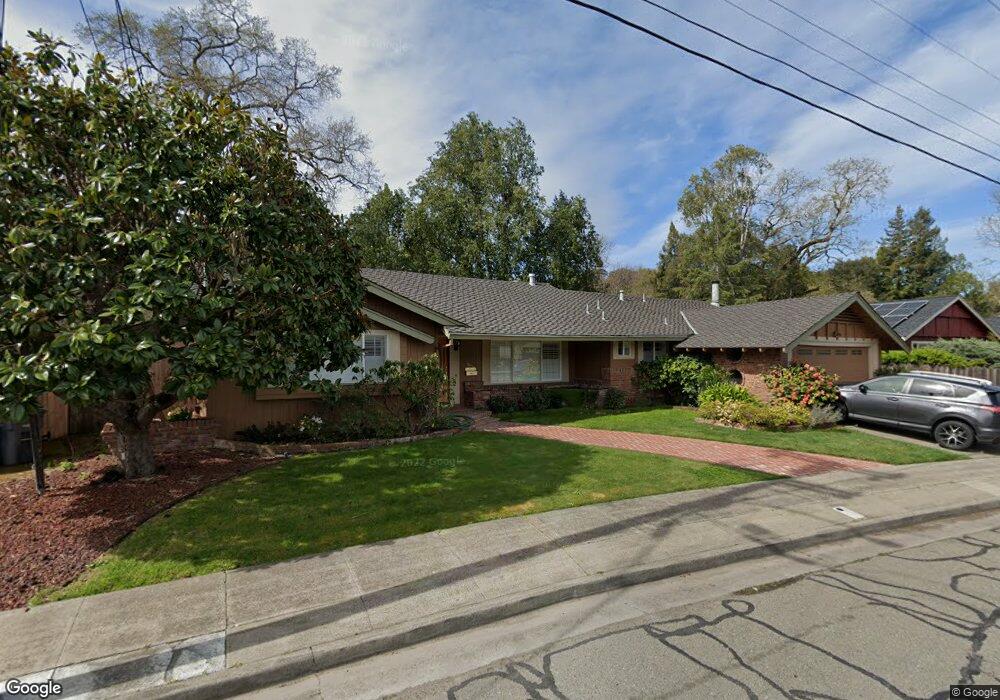
3352 Cypress Way Santa Rosa, CA 95405
Montgomery Village NeighborhoodEstimated Value: $839,264 - $946,000
2
Beds
3
Baths
2,107
Sq Ft
$414/Sq Ft
Est. Value
About This Home
This home is located at 3352 Cypress Way, Santa Rosa, CA 95405 and is currently estimated at $873,066, approximately $414 per square foot. 3352 Cypress Way is a home located in Sonoma County with nearby schools including Herbert Slater Middle School, Montgomery High School, and Village Elementary Charter School.
Ownership History
Date
Name
Owned For
Owner Type
Purchase Details
Closed on
Aug 8, 2019
Sold by
Pierre Marybeth
Bought by
Pierre Marybeth
Current Estimated Value
Home Financials for this Owner
Home Financials are based on the most recent Mortgage that was taken out on this home.
Original Mortgage
$1,089,787
Outstanding Balance
$952,676
Interest Rate
3.61%
Mortgage Type
FHA
Estimated Equity
-$79,610
Purchase Details
Closed on
Oct 18, 2012
Sold by
Pierre Marybeth and The Ronald Pierre & Marybeth P
Bought by
Pierre Marybeth and The Pierre Survivors Trust
Purchase Details
Closed on
Mar 4, 1998
Sold by
Beth Pierre Ronald D and Beth Mary
Bought by
Pierre Ronald and Pierre Marybeth
Purchase Details
Closed on
Jul 25, 1994
Sold by
Blas Cleoff R and Blas Albert Leilani
Bought by
Blas Salvador and Blas Judith C
Home Financials for this Owner
Home Financials are based on the most recent Mortgage that was taken out on this home.
Original Mortgage
$162,000
Interest Rate
4%
Create a Home Valuation Report for This Property
The Home Valuation Report is an in-depth analysis detailing your home's value as well as a comparison with similar homes in the area
Home Values in the Area
Average Home Value in this Area
Purchase History
| Date | Buyer | Sale Price | Title Company |
|---|---|---|---|
| Pierre Marybeth | -- | Fnc Title Services Llc | |
| Pierre Marybeth | -- | None Available | |
| Pierre Ronald | -- | -- | |
| Blas Salvador | -- | First American Title |
Source: Public Records
Mortgage History
| Date | Status | Borrower | Loan Amount |
|---|---|---|---|
| Open | Pierre Marybeth | $1,089,787 | |
| Closed | Blas Salvador | $162,000 |
Source: Public Records
Tax History Compared to Growth
Tax History
| Year | Tax Paid | Tax Assessment Tax Assessment Total Assessment is a certain percentage of the fair market value that is determined by local assessors to be the total taxable value of land and additions on the property. | Land | Improvement |
|---|---|---|---|---|
| 2025 | $3,462 | $295,168 | $82,986 | $212,182 |
| 2024 | $3,462 | $289,381 | $81,359 | $208,022 |
| 2023 | $3,462 | $283,708 | $79,764 | $203,944 |
| 2022 | $3,198 | $278,146 | $78,200 | $199,946 |
| 2021 | $3,133 | $272,693 | $76,667 | $196,026 |
| 2020 | $3,121 | $269,897 | $75,881 | $194,016 |
| 2019 | $3,089 | $264,606 | $74,394 | $190,212 |
| 2018 | $3,067 | $259,419 | $72,936 | $186,483 |
| 2017 | $3,009 | $254,333 | $71,506 | $182,827 |
| 2016 | $2,970 | $249,347 | $70,104 | $179,243 |
| 2015 | $2,870 | $245,602 | $69,051 | $176,551 |
| 2014 | $2,765 | $240,792 | $67,699 | $173,093 |
Source: Public Records
Map
Nearby Homes
- 1508 Ronne Dr
- 1616 Deer Run
- 1648 Ronne Dr
- 1420 Franquette Ave
- 1370 Townview Ave Unit 205
- 3563 Hoen Ave
- 1531 Camden Ct
- 1947 Knolls Dr
- 3735 Sacramento Ave
- 2162 Knolls Dr
- 2530 Tachevah Dr
- 2080 Mount Olive Way
- 780 Hoen Ct
- 732 Church St
- 3954 Holland Dr
- 2566 Tachevah Dr
- 2270 Knolls Hills Cir
- 1109 Evans Dr
- 4068 Siskiyou Ave
- 1740 Cork Tree Ln
- 3344 Cypress Way
- 3410 Cypress Way
- 3349 Cypress Way
- 3338 Cypress Way
- 3417 Cypress Way
- 3341 Cypress Way
- 3418 Cypress Way
- 3335 Cypress Way
- 1624 Hillview Terrace
- 1546 Ronne Dr
- 1619 Hillview Terrace
- 3425 Cypress Way
- 3330 Cypress Way
- 1514 Ronne Dr
- 3327 Cypress Way
- 3424 Cypress Way
- 1625 Hillview Terrace
- 1632 Hillview Terrace
- 3319 Cypress Way
- 3322 Cypress Way