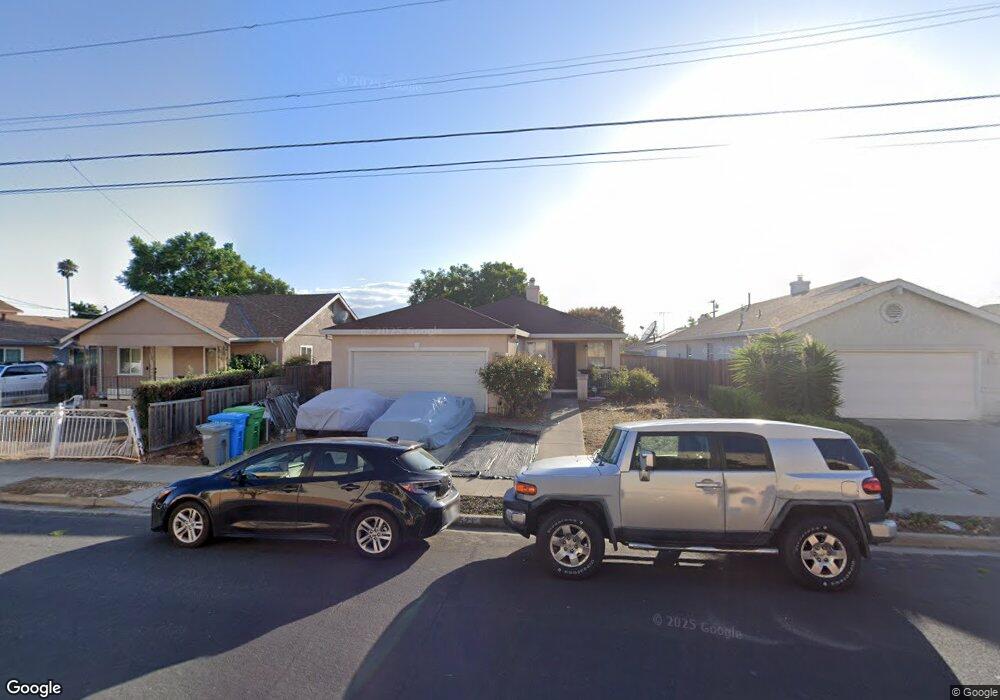
33523 2nd St Union City, CA 94587
Downtown Union City NeighborhoodEstimated Value: $871,000 - $1,111,000
4
Beds
2
Baths
1,475
Sq Ft
$678/Sq Ft
Est. Value
About This Home
This home is located at 33523 2nd St, Union City, CA 94587 and is currently estimated at $1,000,538, approximately $678 per square foot. 33523 2nd St is a home located in Alameda County with nearby schools including Guy Jr. Emanuele Elementary School, Cesar Chavez Middle School, and James Logan High School.
Ownership History
Date
Name
Owned For
Owner Type
Purchase Details
Closed on
Apr 11, 2019
Sold by
Nguyen Nikki T
Bought by
Chiu Curtis
Current Estimated Value
Home Financials for this Owner
Home Financials are based on the most recent Mortgage that was taken out on this home.
Original Mortgage
$221,000
Outstanding Balance
$194,689
Interest Rate
4.4%
Mortgage Type
New Conventional
Estimated Equity
$805,849
Purchase Details
Closed on
May 27, 2005
Sold by
Aguayo Frank and Aguayo Jacqueline
Bought by
Chiu Curtis
Home Financials for this Owner
Home Financials are based on the most recent Mortgage that was taken out on this home.
Original Mortgage
$215,100
Interest Rate
5.74%
Mortgage Type
Stand Alone First
Purchase Details
Closed on
Jan 17, 1997
Sold by
Champion Stern and Champion Homebuilders
Bought by
Aguayo Frank and Aguayo Jaqueline
Home Financials for this Owner
Home Financials are based on the most recent Mortgage that was taken out on this home.
Original Mortgage
$163,000
Interest Rate
7.58%
Create a Home Valuation Report for This Property
The Home Valuation Report is an in-depth analysis detailing your home's value as well as a comparison with similar homes in the area
Home Values in the Area
Average Home Value in this Area
Purchase History
| Date | Buyer | Sale Price | Title Company |
|---|---|---|---|
| Chiu Curtis | -- | Servicelink | |
| Chiu Curtis | $269,000 | First California Title | |
| Aguayo Frank | $189,000 | North American Title Co |
Source: Public Records
Mortgage History
| Date | Status | Borrower | Loan Amount |
|---|---|---|---|
| Open | Chiu Curtis | $221,000 | |
| Closed | Chiu Curtis | $215,100 | |
| Previous Owner | Aguayo Frank | $163,000 | |
| Closed | Aguayo Frank | $16,550 |
Source: Public Records
Tax History Compared to Growth
Tax History
| Year | Tax Paid | Tax Assessment Tax Assessment Total Assessment is a certain percentage of the fair market value that is determined by local assessors to be the total taxable value of land and additions on the property. | Land | Improvement |
|---|---|---|---|---|
| 2025 | $6,157 | $374,787 | $348,445 | $26,342 |
| 2024 | $6,157 | $367,441 | $341,615 | $25,826 |
| 2023 | $5,926 | $360,236 | $334,917 | $25,319 |
| 2022 | $5,803 | $353,175 | $328,352 | $24,823 |
| 2021 | $5,674 | $346,251 | $321,915 | $24,336 |
| 2020 | $5,572 | $342,702 | $318,615 | $24,087 |
| 2019 | $5,614 | $335,985 | $312,370 | $23,615 |
| 2018 | $5,482 | $329,399 | $306,247 | $23,152 |
| 2017 | $5,350 | $322,943 | $300,245 | $22,698 |
| 2016 | $5,159 | $316,613 | $294,360 | $22,253 |
| 2015 | $5,057 | $311,859 | $289,940 | $21,919 |
| 2014 | $4,853 | $305,752 | $284,262 | $21,490 |
Source: Public Records
Map
Nearby Homes
- 33548 4th St
- 33603 3rd St
- 33718 3rd St
- 902 G St
- 33840 10th St
- 33848 10th St
- 33853 10th St
- 33528 13th St
- 33721 12th St
- 34237 Torrey Pine Ln
- 33359 University Dr
- 33852 11th St
- 1028 Montoya Terrace Unit 2
- 136 Tamarack Dr
- 33846 14th St
- 126 Bellflower Ln
- 32306 Ithaca St
- 1870 Sherman Dr
- 32072 Chicoine Ave
- 1027 Chalcedony Terrace