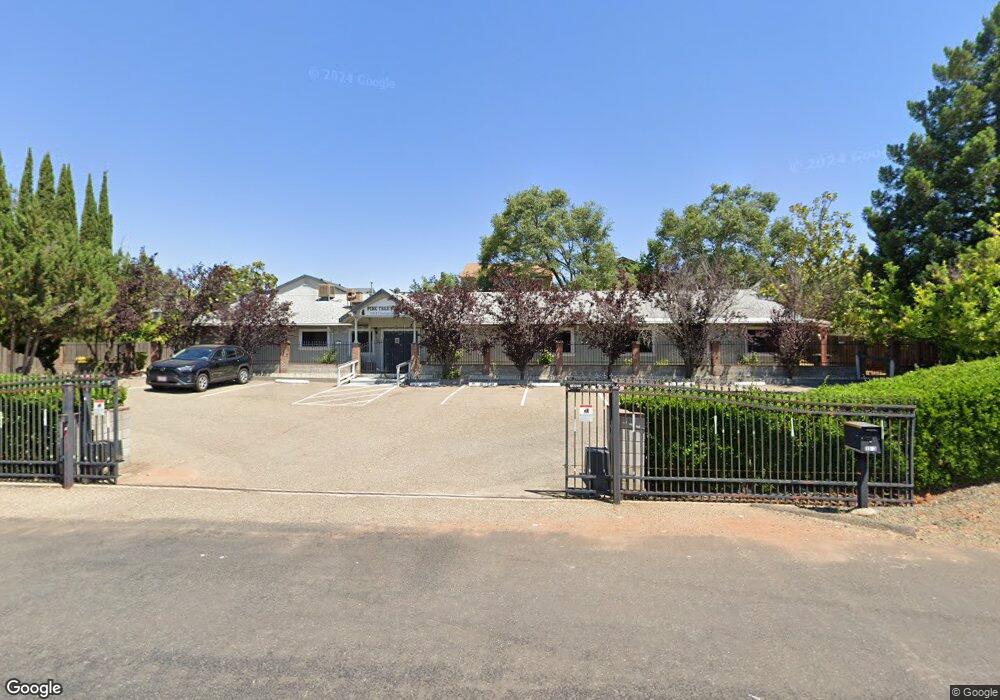
3353 Cimmarron Rd Cameron Park, CA 95682
Estimated Value: $1,701,695
9
Beds
6
Baths
3,920
Sq Ft
$434/Sq Ft
Est. Value
About This Home
This home is located at 3353 Cimmarron Rd, Cameron Park, CA 95682 and is currently estimated at $1,701,695, approximately $434 per square foot. 3353 Cimmarron Rd is a home located in El Dorado County with nearby schools including Green Valley Elementary School, Pleasant Grove Middle School, and Ponderosa High School.
Ownership History
Date
Name
Owned For
Owner Type
Purchase Details
Closed on
Jan 10, 2005
Sold by
Cindea Vasile and Cindea Margareta
Bought by
Marasigan Francisco J and Marasigan Erlinda R
Current Estimated Value
Home Financials for this Owner
Home Financials are based on the most recent Mortgage that was taken out on this home.
Original Mortgage
$835,000
Interest Rate
5.67%
Mortgage Type
Small Business Administration
Purchase Details
Closed on
Dec 9, 1998
Sold by
Bcc Reo Llc
Bought by
Cindea Vasile and Cindea Margareta
Home Financials for this Owner
Home Financials are based on the most recent Mortgage that was taken out on this home.
Original Mortgage
$178,750
Interest Rate
6.78%
Purchase Details
Closed on
Dec 27, 1996
Sold by
Chrysler First Business Credit Corp
Bought by
Bcc Reo Llc
Create a Home Valuation Report for This Property
The Home Valuation Report is an in-depth analysis detailing your home's value as well as a comparison with similar homes in the area
Home Values in the Area
Average Home Value in this Area
Purchase History
| Date | Buyer | Sale Price | Title Company |
|---|---|---|---|
| Marasigan Francisco J | $1,100,000 | Fidelity Natl Title Co | |
| Cindea Vasile | -- | Chicago Title Co | |
| Bcc Reo Llc | $185,000 | Chicago Title |
Source: Public Records
Mortgage History
| Date | Status | Borrower | Loan Amount |
|---|---|---|---|
| Previous Owner | Marasigan Francisco J | $835,000 | |
| Previous Owner | Cindea Vasile | $178,750 |
Source: Public Records
Tax History
| Year | Tax Paid | Tax Assessment Tax Assessment Total Assessment is a certain percentage of the fair market value that is determined by local assessors to be the total taxable value of land and additions on the property. | Land | Improvement |
|---|---|---|---|---|
| 2025 | $19,552 | $1,597,570 | $418,164 | $1,179,406 |
| 2024 | $19,552 | $1,564,447 | $409,965 | $1,154,482 |
| 2023 | $19,228 | $1,532,058 | $401,927 | $1,130,131 |
| 2022 | $18,877 | $1,489,965 | $394,047 | $1,095,918 |
| 2021 | $18,688 | $1,459,488 | $386,321 | $1,073,167 |
| 2020 | $18,437 | $1,442,919 | $382,360 | $1,060,559 |
| 2019 | $15,733 | $1,411,710 | $374,863 | $1,036,847 |
| 2018 | $15,287 | $1,382,989 | $367,513 | $1,015,476 |
| 2017 | $14,971 | $1,353,346 | $360,307 | $993,039 |
| 2016 | $14,782 | $1,324,515 | $353,243 | $971,272 |
| 2015 | $14,237 | $1,302,400 | $347,938 | $954,462 |
| 2014 | $14,237 | $1,274,991 | $341,123 | $933,868 |
Source: Public Records
Map
Nearby Homes
- 3363 Cimmarron Rd
- 2537 Chesapeake Bay Cir
- 3381 La Canada Dr Unit 8
- 3281 La Canada Dr
- 3394 La Canada Dr
- 2628 Royal Park Dr
- 3399 Maricopa Ct
- 2681 Cameron Park Dr Unit 155
- 2681 Cameron Park Dr Unit 54
- 2681 Cameron Park Dr Unit 146
- 2681 Cameron Park Dr Unit 47
- 2681 Cameron Park Dr Unit 170
- 2681 Cameron Park Dr Unit 145
- 2681 Cameron Park Dr Unit 132
- 2725 Yuma Ct
- 2797 Alhambra Dr
- 2805 Alhambra Dr
- 2743 Yuma Ct
- 2963 Royal Park Ct
- 2435 Sandpiper Way
- 2577 Chesapeake Bay Cir
- 2573 Chesapeake Bay Cir
- 2569 Chesapeake Bay Cir
- 2565 Chesapeake Bay Cir
- 3341 Cimmarron Rd
- 2585 Chesapeake Bay Cir
- 2561 Chesapeake Bay Cir
- 2589 Chesapeake Bay Cir
- 2576 Chesapeake Bay Cir
- 2570 Chesapeake Bay Cir
- 2557 Chesapeake Bay Cir
- 2593 Chesapeake Bay Cir
- 2553 Chesapeake Bay Cir
- 2598 Chesapeake Bay Cir
- 2597 Chesapeake Bay Cir
- 304 Chesapeake Bay Ct
- 3336 Cimmarron Rd
- 2558 Chesapeake Bay Cir
- 2549 Chesapeake Bay Cir
- 2601 Chesapeake Bay Cir
Your Personal Tour Guide
Ask me questions while you tour the home.