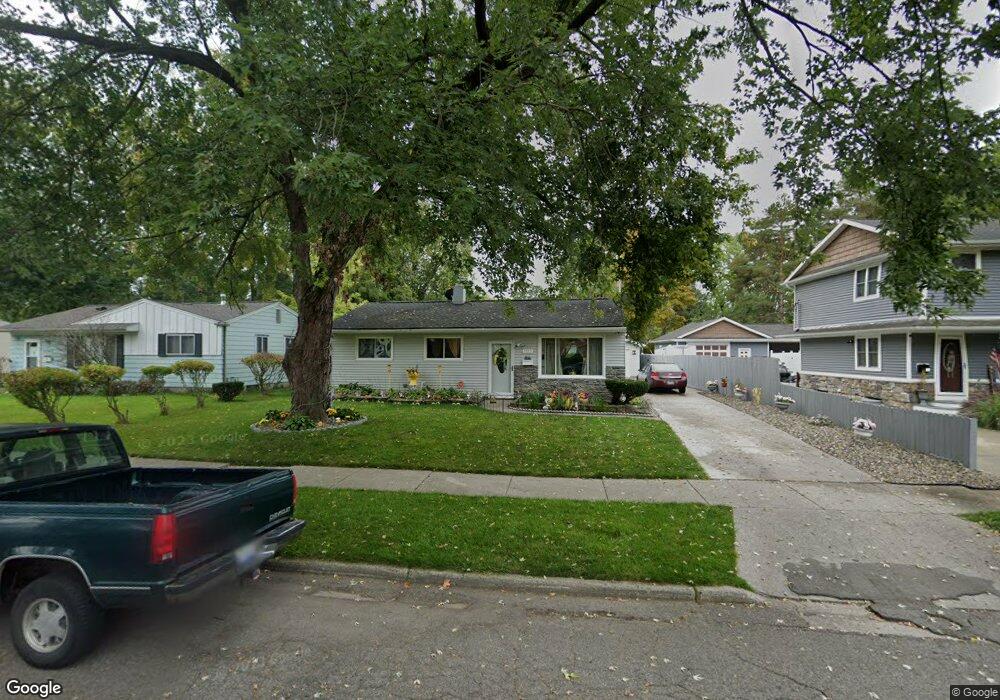
3353 Glenbrook Dr Lansing, MI 48911
Churchill Downs NeighborhoodEstimated Value: $152,163 - $195,000
3
Beds
2
Baths
1,262
Sq Ft
$141/Sq Ft
Est. Value
About This Home
This home is located at 3353 Glenbrook Dr, Lansing, MI 48911 and is currently estimated at $177,791, approximately $140 per square foot. 3353 Glenbrook Dr is a home located in Ingham County with nearby schools including Averill Elementary School, Attwood School, and J.W. Sexton High School.
Ownership History
Date
Name
Owned For
Owner Type
Purchase Details
Closed on
Jan 13, 2025
Sold by
Latham Thomas
Bought by
Latham Thomas and Latham Patsy
Current Estimated Value
Purchase Details
Closed on
Jul 15, 2011
Sold by
Carey & Conner Consulting Firm Llc
Bought by
Latham Thomas
Home Financials for this Owner
Home Financials are based on the most recent Mortgage that was taken out on this home.
Original Mortgage
$78,946
Interest Rate
4.75%
Mortgage Type
FHA
Purchase Details
Closed on
Nov 13, 2009
Sold by
Everhome Mortgage Company
Bought by
Federal National Mortgage Association
Purchase Details
Closed on
Nov 12, 2009
Sold by
Freeman Grady and Curry Darcell D
Bought by
Everhome Mortgage Company
Purchase Details
Closed on
Jul 27, 1999
Sold by
Kelley Albert Lee and Kelley Barbara A
Bought by
Freeman Grady
Home Financials for this Owner
Home Financials are based on the most recent Mortgage that was taken out on this home.
Original Mortgage
$63,200
Interest Rate
11.65%
Create a Home Valuation Report for This Property
The Home Valuation Report is an in-depth analysis detailing your home's value as well as a comparison with similar homes in the area
Home Values in the Area
Average Home Value in this Area
Purchase History
| Date | Buyer | Sale Price | Title Company |
|---|---|---|---|
| Latham Thomas | -- | None Listed On Document | |
| Latham Thomas | $81,000 | Tri County Title Agency Llc | |
| Federal National Mortgage Association | -- | None Available | |
| Everhome Mortgage Company | $65,406 | None Available | |
| Freeman Grady | $79,000 | -- |
Source: Public Records
Mortgage History
| Date | Status | Borrower | Loan Amount |
|---|---|---|---|
| Previous Owner | Latham Thomas | $78,946 | |
| Previous Owner | Freeman Grady | $63,200 |
Source: Public Records
Tax History
| Year | Tax Paid | Tax Assessment Tax Assessment Total Assessment is a certain percentage of the fair market value that is determined by local assessors to be the total taxable value of land and additions on the property. | Land | Improvement |
|---|---|---|---|---|
| 2025 | $2,556 | $66,500 | $9,300 | $57,200 |
| 2024 | $20 | $63,700 | $9,300 | $54,400 |
| 2023 | $2,397 | $57,400 | $9,300 | $48,100 |
| 2022 | $2,163 | $49,800 | $9,300 | $40,500 |
| 2021 | $2,118 | $46,200 | $7,000 | $39,200 |
| 2020 | $2,105 | $43,000 | $7,000 | $36,000 |
| 2019 | $2,017 | $41,800 | $7,000 | $34,800 |
| 2018 | $1,891 | $35,600 | $7,000 | $28,600 |
| 2017 | $1,810 | $35,600 | $7,000 | $28,600 |
| 2016 | $1,731 | $31,800 | $7,000 | $24,800 |
| 2015 | $1,731 | $31,000 | $13,909 | $17,091 |
| 2014 | $1,731 | $30,400 | $21,637 | $8,763 |
Source: Public Records
Map
Nearby Homes
- 3721 Kendalwood Dr
- 3100 Glenbrook Dr
- 3924 Wedgewood Dr
- 3230 S Deerfield Ave
- 0 S Deerfield Ave
- 3112 Shetland Rd
- 4209 Brighton Dr
- 3714 Brighton Dr
- 3907 Ingham St
- 3618 Malibu Dr
- 4416 Ballard Rd
- 3945 Windward Dr
- 4400 Chadburne Dr
- 2820 Reo Rd
- 2408 Dunlap St
- 4130 Windward Dr
- 4113 Heathgate Dr
- 2 Locust Ln
- 3214 Raynell St
- 3425 Cooley Dr
- 3401 Glenbrook Dr
- 3347 Glenbrook Dr
- 3407 Glenbrook Dr
- 3339 Glenbrook Dr
- 3333 Glenbrook Dr
- 3328 Grantsburg Dr
- 3332 Grantsburg Dr
- 3354 Glenbrook Dr
- 3400 Glenbrook Dr
- 3348 Glenbrook Dr
- 3338 Grantsburg Dr
- 3406 Glenbrook Dr
- 3342 Glenbrook Dr
- 3322 Grantsburg Dr
- 3336 Glenbrook Dr
- 3319 Glenbrook Dr
- 3342 Grantsburg Dr
- 3316 Grantsburg Dr
- 3330 Glenbrook Dr
Your Personal Tour Guide
Ask me questions while you tour the home.