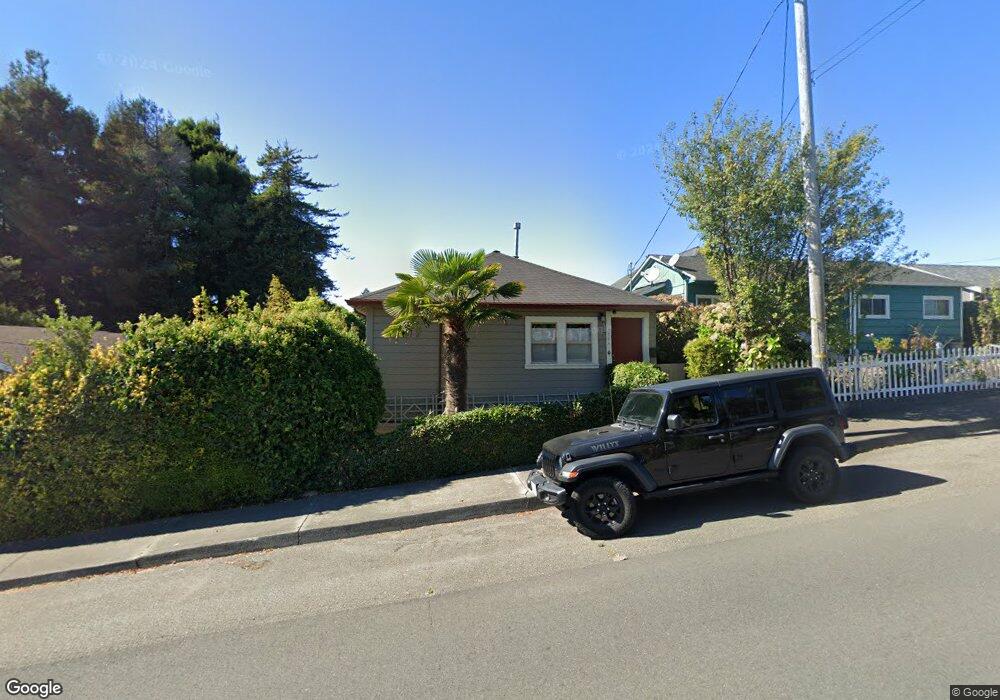
3354 E St Eureka, CA 95503
Rosewood NeighborhoodEstimated Value: $282,569 - $314,000
2
Beds
2
Baths
816
Sq Ft
$362/Sq Ft
Est. Value
About This Home
This home is located at 3354 E St, Eureka, CA 95503 and is currently estimated at $295,142, approximately $361 per square foot. 3354 E St is a home located in Humboldt County with nearby schools including Grant Elementary School, Winship Middle School, and Eureka Senior High School.
Ownership History
Date
Name
Owned For
Owner Type
Purchase Details
Closed on
Jan 27, 2003
Sold by
Berry Janice K and Berry Janice T
Bought by
Schubert Dean D and Showalter Brittany N
Current Estimated Value
Home Financials for this Owner
Home Financials are based on the most recent Mortgage that was taken out on this home.
Original Mortgage
$95,920
Outstanding Balance
$46,115
Interest Rate
7.65%
Estimated Equity
$249,027
Purchase Details
Closed on
Mar 22, 2002
Sold by
Mccormick Timothy F
Bought by
Berry Janice T
Home Financials for this Owner
Home Financials are based on the most recent Mortgage that was taken out on this home.
Original Mortgage
$83,250
Interest Rate
6.94%
Purchase Details
Closed on
Dec 21, 2000
Sold by
Curtis Shirley
Bought by
Mccormick Timothy F
Create a Home Valuation Report for This Property
The Home Valuation Report is an in-depth analysis detailing your home's value as well as a comparison with similar homes in the area
Home Values in the Area
Average Home Value in this Area
Purchase History
| Date | Buyer | Sale Price | Title Company |
|---|---|---|---|
| Schubert Dean D | $120,000 | Fidelity National | |
| Berry Janice T | $92,500 | Fidelity National Title Co | |
| Mccormick Timothy F | $59,000 | Humboldt Land Title Company |
Source: Public Records
Mortgage History
| Date | Status | Borrower | Loan Amount |
|---|---|---|---|
| Open | Schubert Dean D | $95,920 | |
| Previous Owner | Berry Janice T | $83,250 | |
| Closed | Schubert Dean D | $23,980 |
Source: Public Records
Tax History
| Year | Tax Paid | Tax Assessment Tax Assessment Total Assessment is a certain percentage of the fair market value that is determined by local assessors to be the total taxable value of land and additions on the property. | Land | Improvement |
|---|---|---|---|---|
| 2025 | $1,885 | $190,440 | $79,646 | $110,794 |
| 2024 | $1,885 | $186,707 | $78,085 | $108,622 |
| 2023 | $1,857 | $183,047 | $76,554 | $106,493 |
| 2022 | $1,926 | $179,458 | $75,053 | $104,405 |
| 2021 | $1,803 | $175,940 | $73,582 | $102,358 |
| 2020 | $1,788 | $174,137 | $72,828 | $101,309 |
| 2019 | $1,750 | $170,723 | $71,400 | $99,323 |
| 2018 | $1,722 | $167,376 | $70,000 | $97,376 |
| 2017 | $1,712 | $164,095 | $68,628 | $95,467 |
| 2016 | $1,711 | $160,879 | $67,283 | $93,596 |
| 2015 | $1,695 | $158,464 | $66,273 | $92,191 |
| 2014 | $1,583 | $155,361 | $64,975 | $90,386 |
Source: Public Records
Map
Nearby Homes
Your Personal Tour Guide
Ask me questions while you tour the home.